
.png)
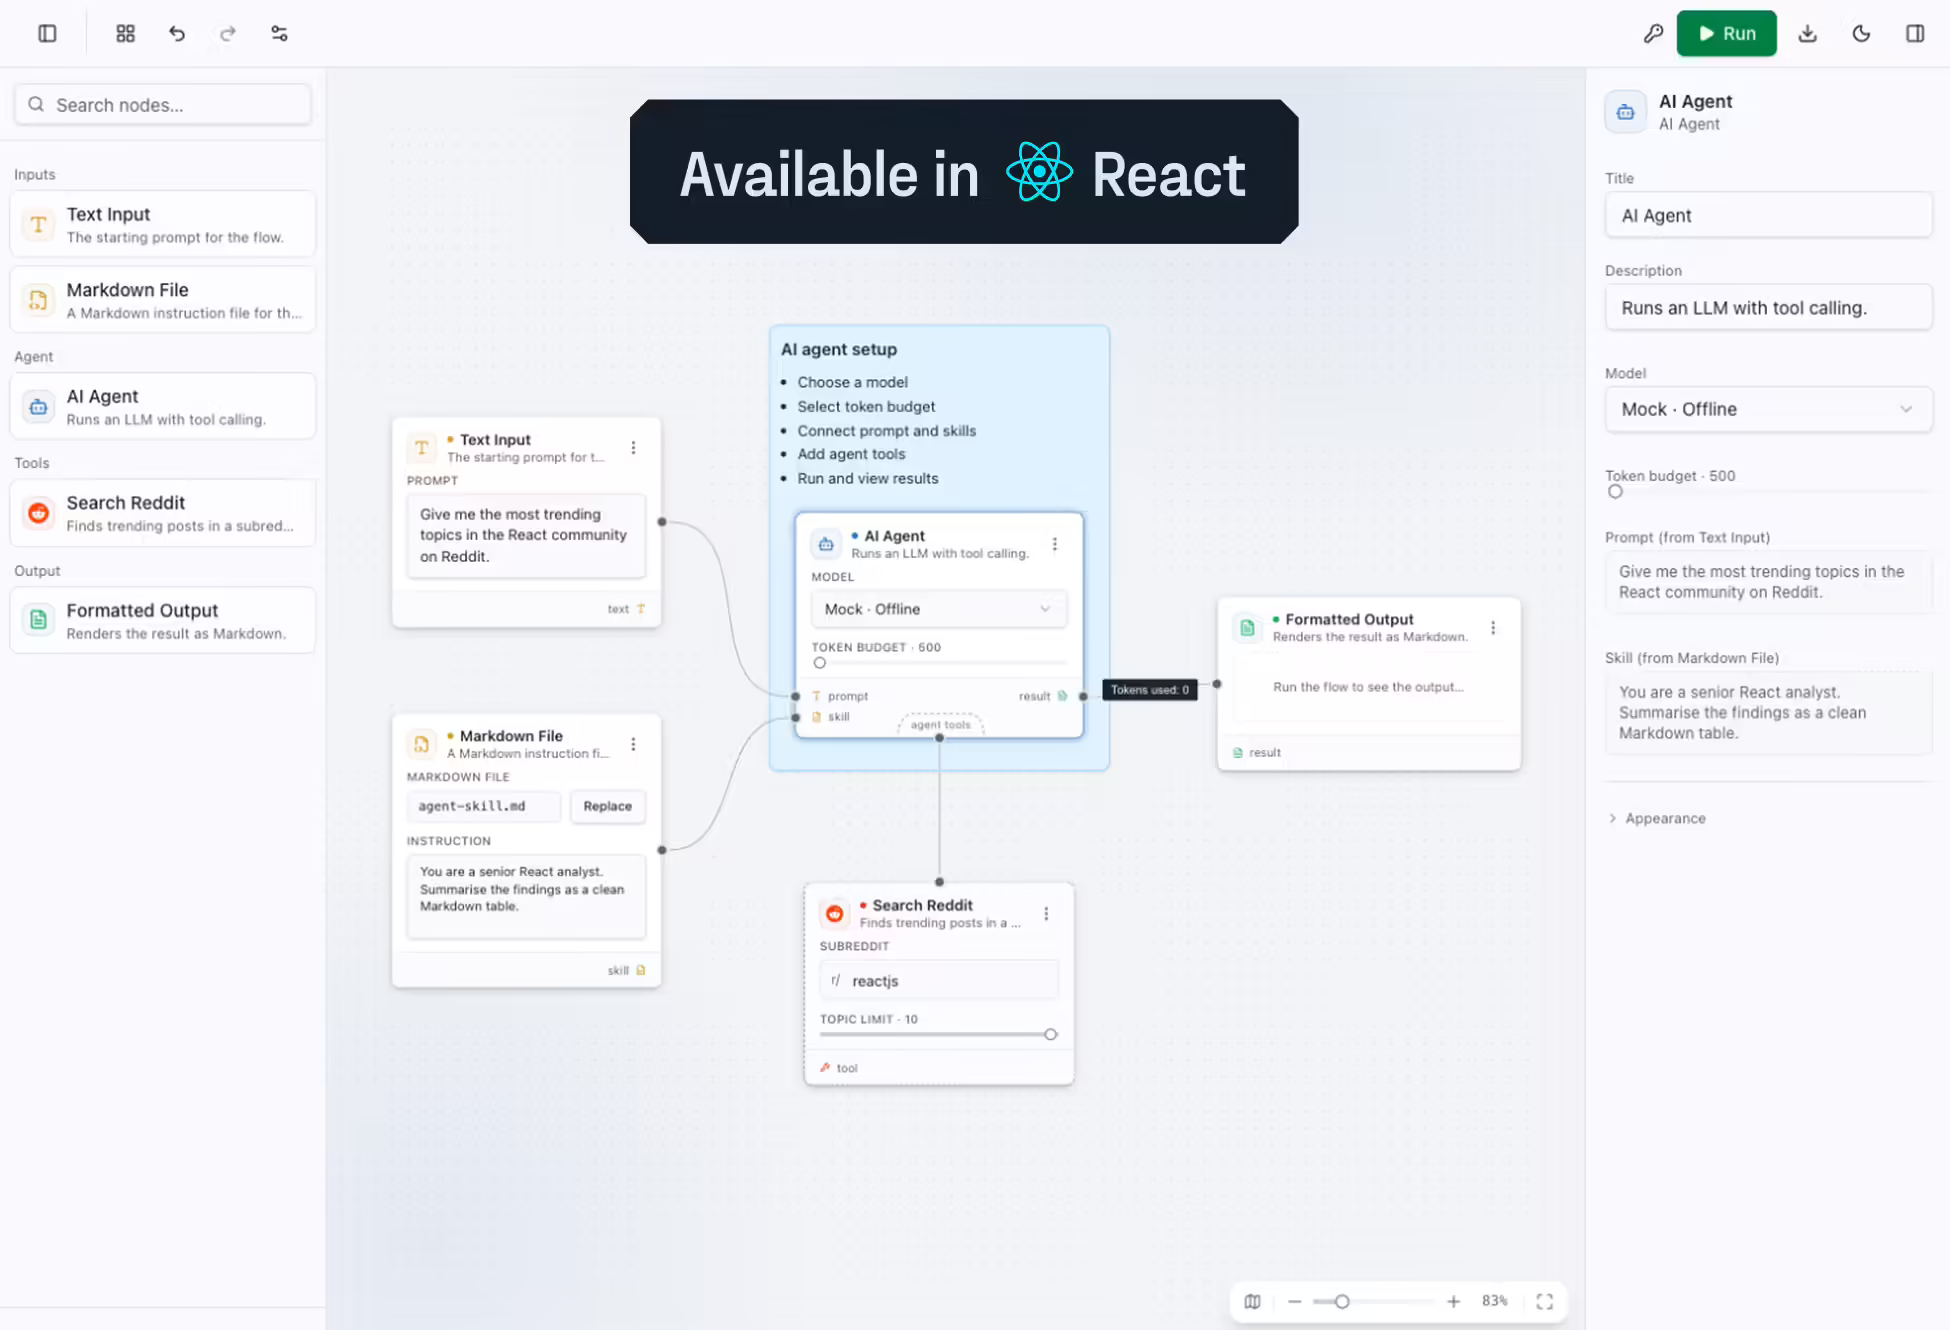
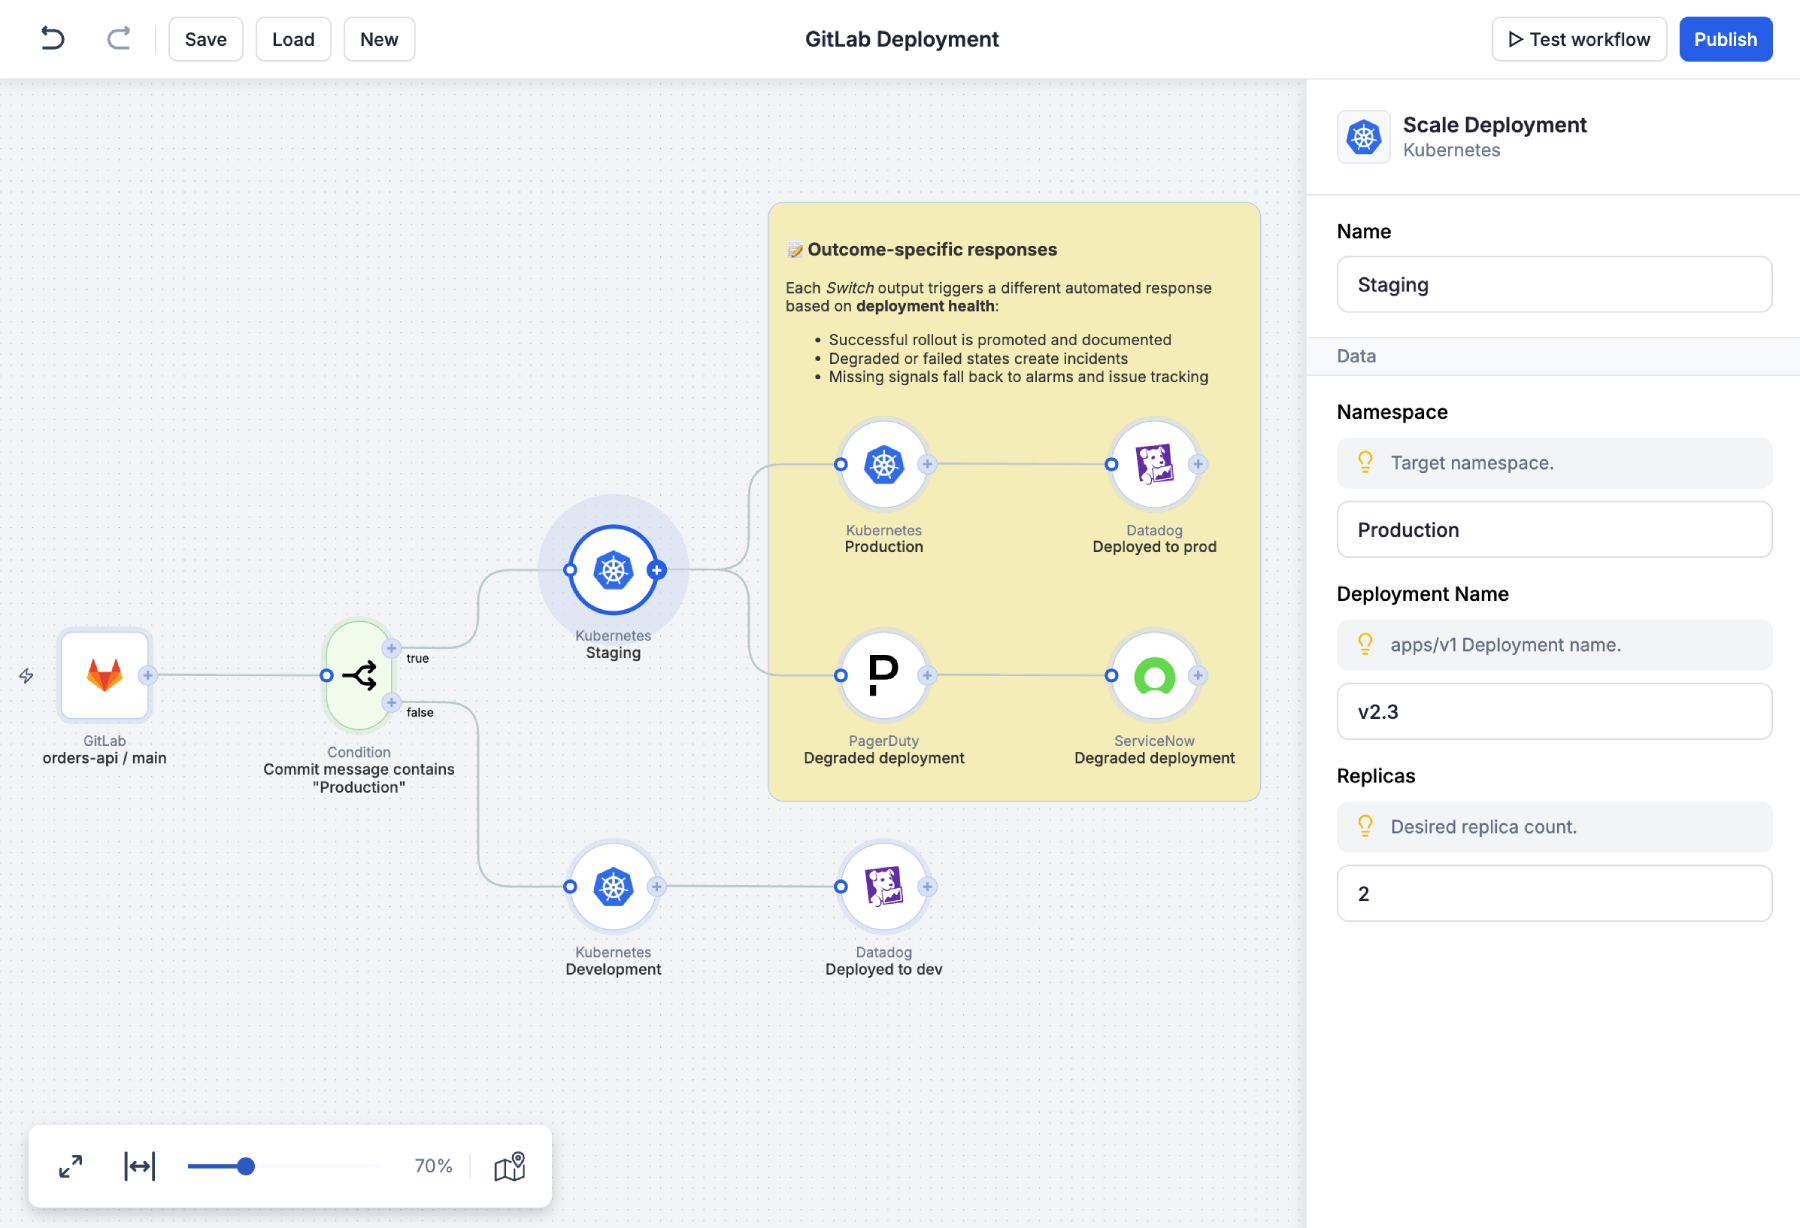
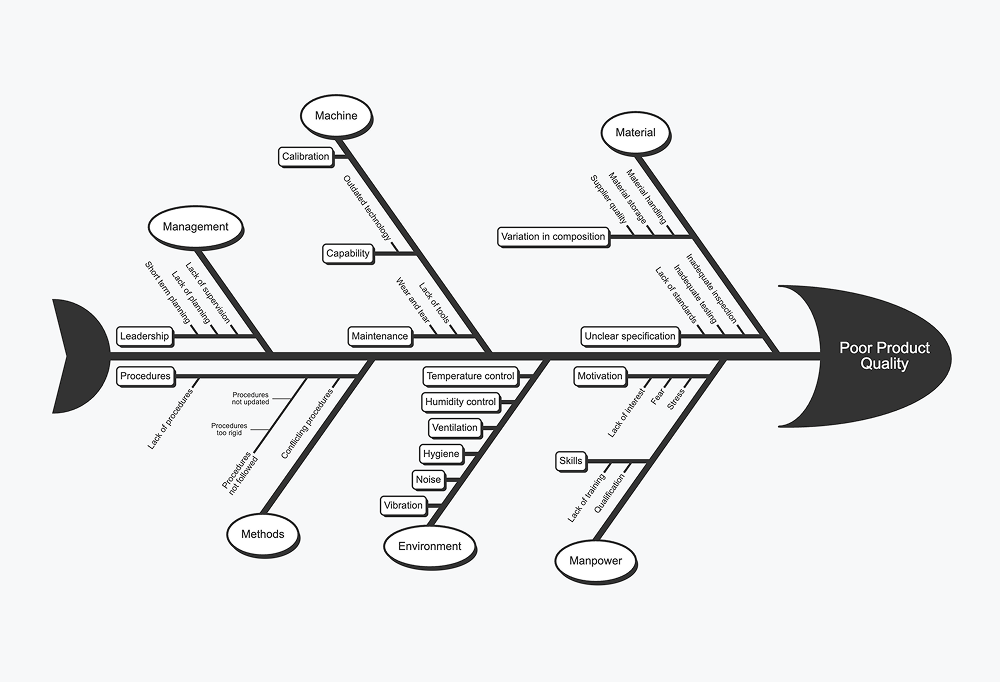
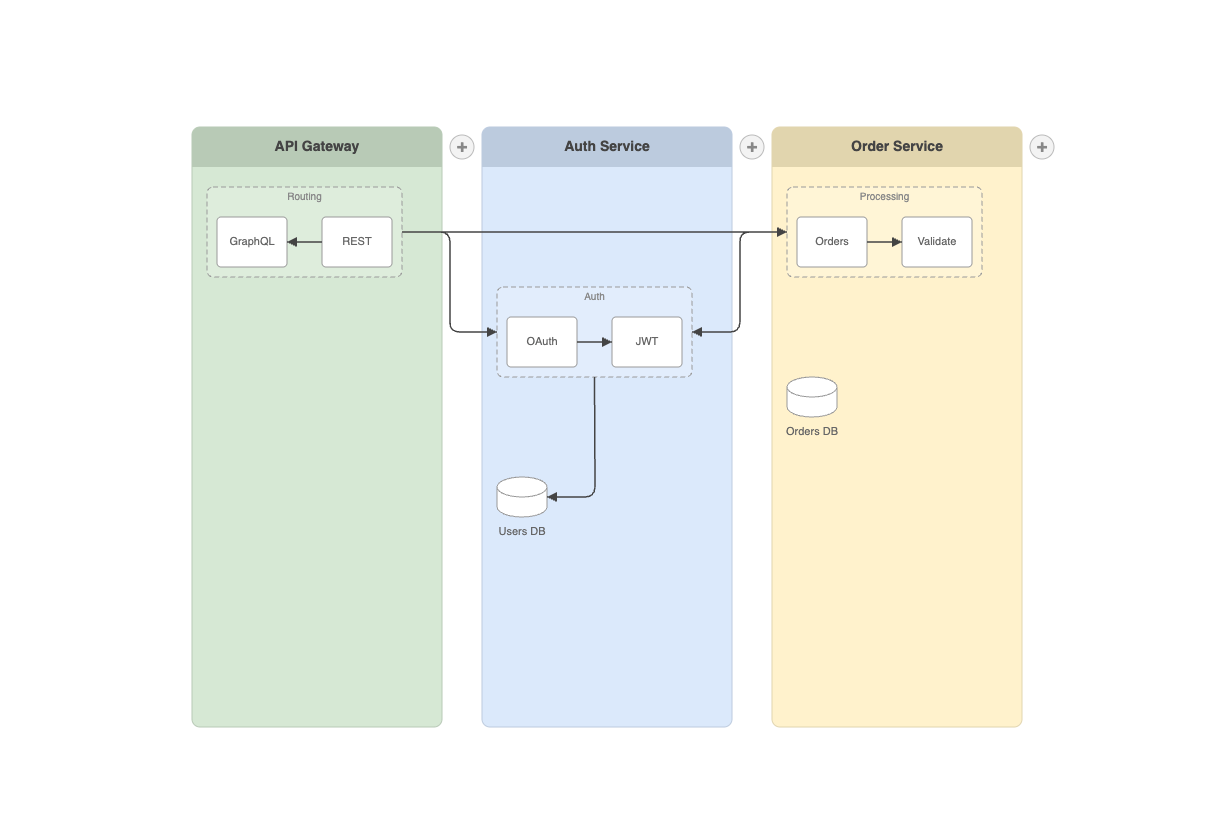
180+ pre-built apps
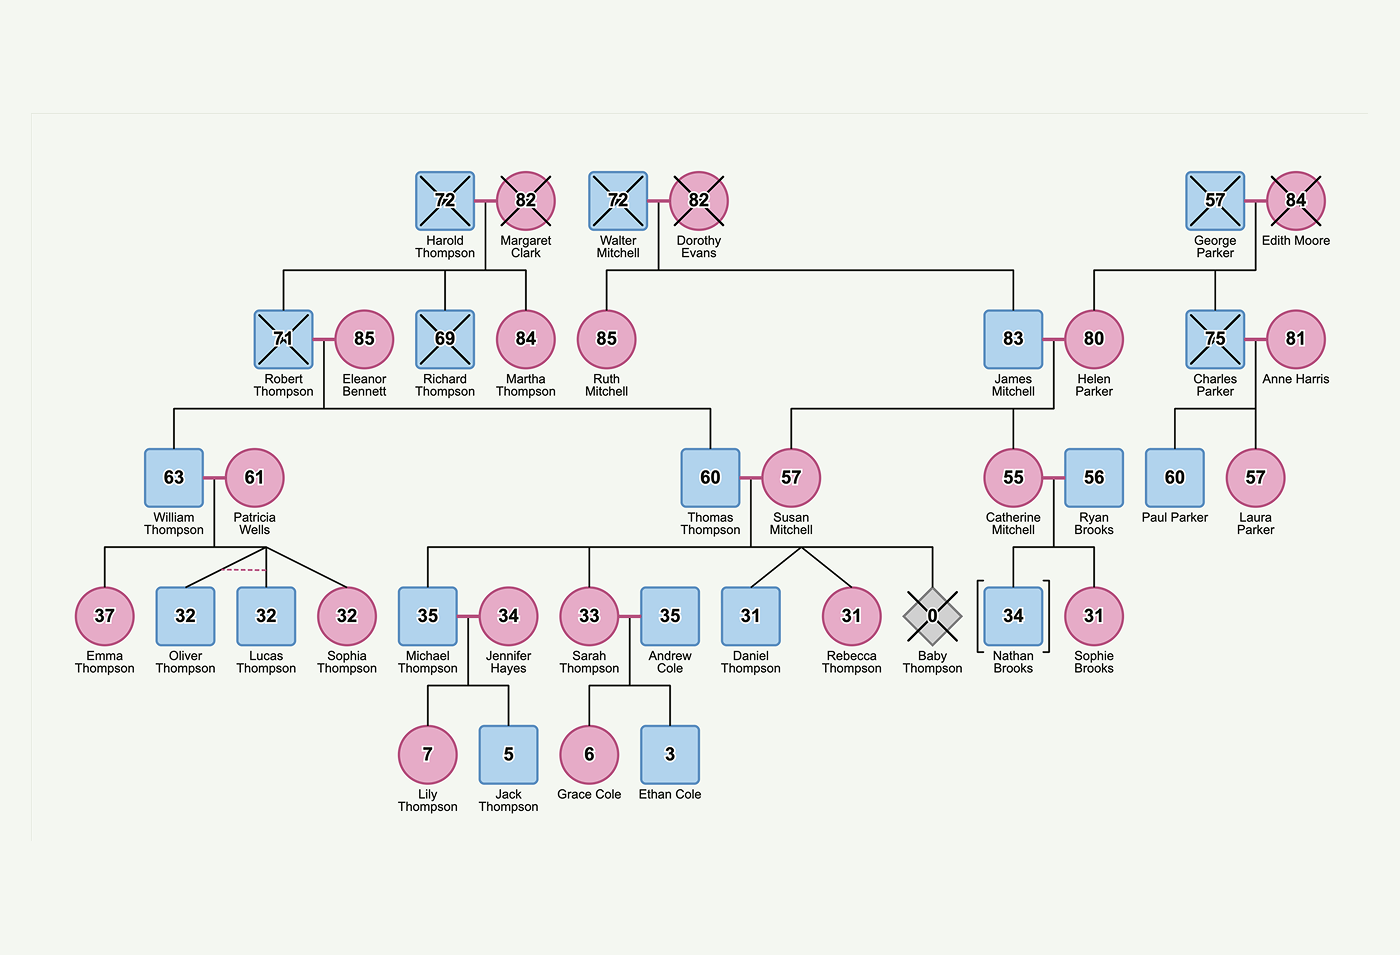
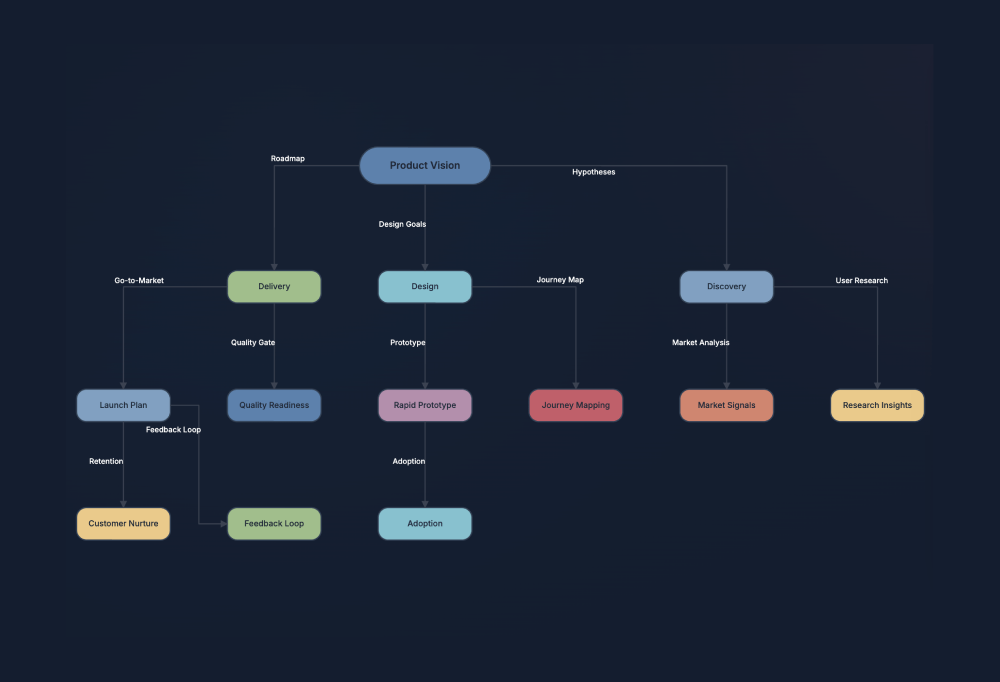
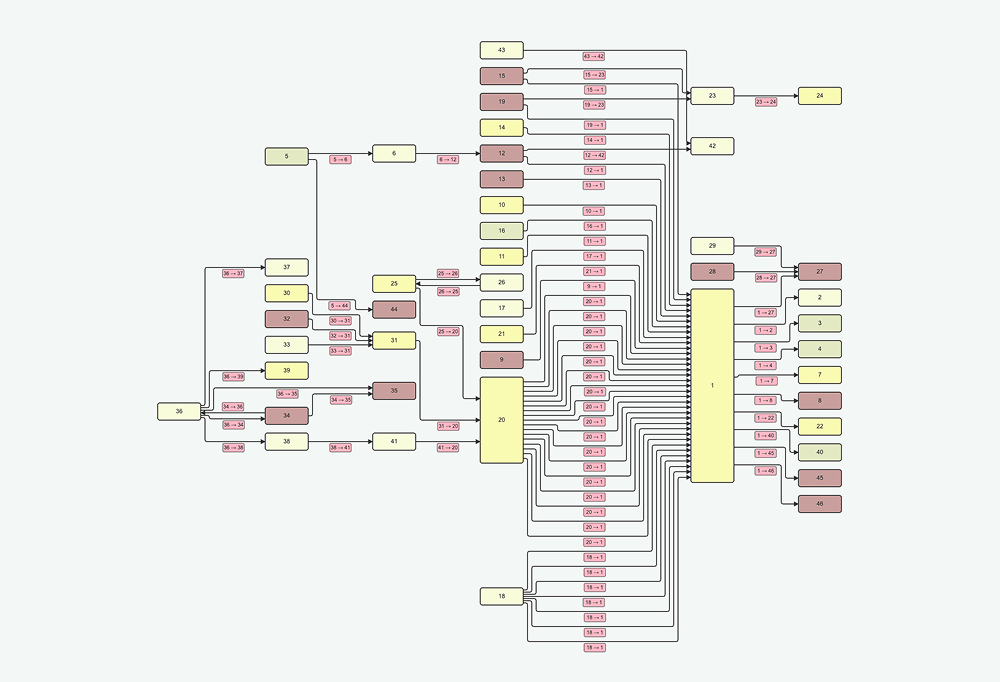
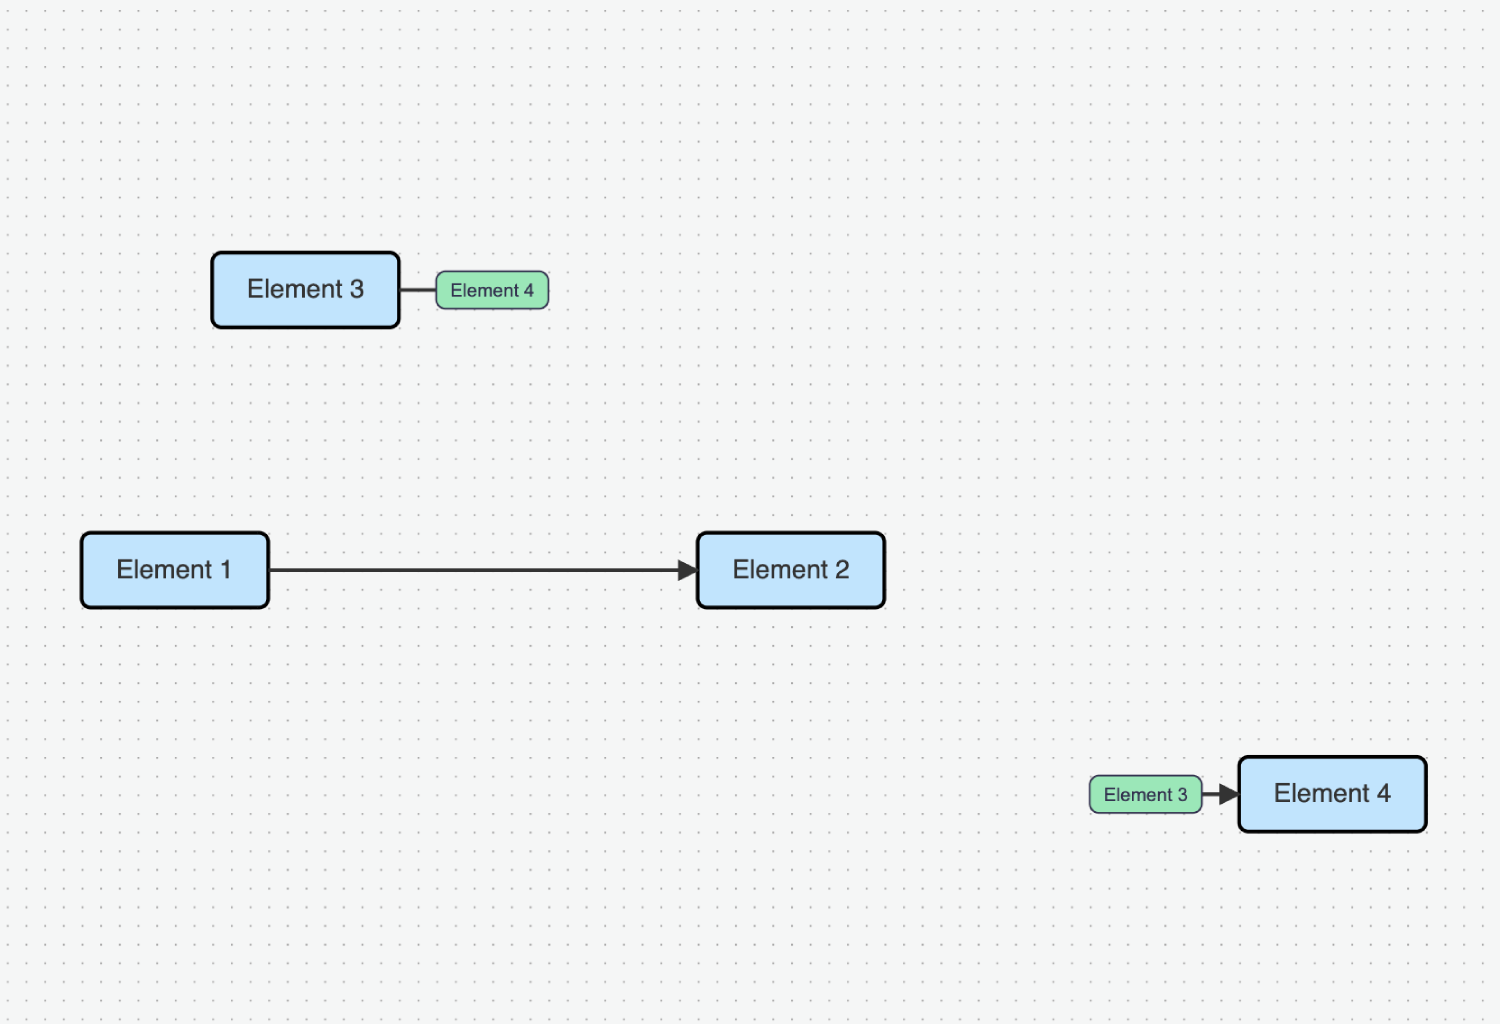
JointJS offers a wide range of pre-built demo applications and features that serve as boilerplates to help you kick off your project.
.png)
.png)


.png)


Results
(
141
)
License:JointJS+
.png)


Nothing found
Please try different keywords or get in touch with us to get a tailored demo.

Looking for something else?
We drop new React demos every week. Tell us what you're building, and we'll create a demo for your use case.


.png)


