
Most diagramming libraries seem promising at first. You can spin up a demo in ten minutes, and it feels like you’ve found the perfect fit. But after a few months, you’re building undo/redo from scratch, fighting to keep the diagram state in sync with your backend, running into roadblocks when customizing UX to your needs, and noticing performance lags as your data grows.
Most diagramming libraries take you just far enough to be committed, but fall short when it comes to building a polished, production-ready product, especially on a tight timeline.
Behind the scenes, the hard part of building a diagramming application isn’t drawing boxes and lines, because every library already does that. The real challenge is supporting the sophisticated interactions users expect (UX/UI), from a modern, intuitive, accessible interface to scalability.
As your diagrams grow from a few nodes to hundreds or thousands, performance has to keep up. And if you’re working in React, you want an integration that feels like React, not a constant struggle with side effects and useRefs.
JointJS has been powering diagramming applications used by millions of people for over a decade, from AI workflow builders and BPMN modelers to industrial automation dashboards, data modeling tools, and much more. Industry leaders worldwide trust it for diagrams that need to work reliably in production.
The JointJS engine solves hard problems, including smart routing algorithms that avoid node overlap, consistent hit testing at any zoom level, DOM management, exceptional UX, outstanding performance, and memory management in production environments.
JointJS for React brings that trusted engine directly to React. This isn’t just a wrapper or a clunky compatibility layer, but a truly idiomatic React API built on top of JointJS.
Diagram state is React state, with a core wrapper component (GraphProvider / Diagram) that manages and provides it to child components, directly connecting the JointJS engine with React’s lifecycle. There’s no hidden state, no imperative API calls, and no synchronization headaches between React’s render cycle and the canvas. What’s in your state is exactly what’s on the screen.
Here’s what a simple JointJS app in React looked like until now, and what it will look like going forward.
Before — JointJS 4.2
// DO NOT USE - Old way of integrating JointJS with React

import { useEffect, useRef } from 'react';
import { dia, shapes } from '@joint/plus';

function JointJs() {
  const canvas = useRef<Element | null>(null);

   useEffect(() => {
       const graph = new dia.Graph();

       const paper = new dia.Paper({
           model: graph,
           background: {
               color: '#F8F9FA',
           },
           frozen: true,
           async: true,
           cellViewNamespace: shapes
       });

       canvas.current?.appendChild(paper.el);

       const rect = new shapes.standard.Rectangle({
          type: 'standard.Rectangle',
          position: { x: 100, y: 100 },
          size: { width: 100, height: 50 },
          attrs: { label: { text: 'Hello World' } },
       });

       graph.addCell(rect);
       paper.unfreeze();

       return () => {
           paper.remove();
       };

   }, []);

   return (
       <div className="canvas" ref={canvas}/>
   );
}

export default JointJs;
The old approach isn’t wrong, but it’s at odds with React’s model. Setup happens inside a useEffect, you access Paper through useRef, and you’re stuck with manual cleanup.
After — JointJS for React
// New way — JointJS for React

  import { GraphProvider, Paper } from '@joint/react';

  const initialCells = [
    {
      type: 'element',
      position: { x: 100, y: 100 },
      data: { label 'Hello World' },
    },
  ];

  export default function App() {
    return (
      <GraphProvider initialCells={initialCells}>
        <Paper className="canvas" />
      </GraphProvider>
    );
  }
JointJS for React fits right in with the rest of your React codebase. You declare what you want, and the framework takes care of the rest. It’s not just more elegant, but actually simpler and more intuitive, too.
In this article, we’ll focus on JointJS+ for React, so it’s worth noting what the actual differences from the open-source version of the library are. Both versions are based on the JointJS diagramming engine.
JointJS for React is a free, community-driven diagramming library. It gives you the core SVG + HTML rendering engine, a solid API, and building blocks for flowcharts, UML, and other diagramming applications. (If you give the open-source version a try and find it helpful, consider leaving a star on GitHub. It’s a small thing, but it means a lot to the team – thanks!))
JointJS+ for React is a commercial extension built on the same core engine, adding numerous ready-to-use UI plugins for snapping, panning, zooming, tooltips, and context menus, plus advanced shapes/styling options on top of what's in the open-source version. It also adds production-focused components not in JointJS at all, like the CommandManager for unlimited undo/redo history tracking, multi-select, and Snaplines/measurement shapes for precision alignment.
JointJS+ includes everything in JointJS and builds on top of it, so it's really a question of whether you want to build the UI layer yourself or have the library do the heavy lifting for you.
Workflow editors like pipeline designers, approval flows, and data-processing graphs are among the most common diagramming apps teams build, and they’re a great benchmark for any library. They let you quickly see whether a tool handles both the basics and the edge cases.
Rendering boxes and arrows is easy; what takes significant effort in development are the editing interactions users expect, connection rules that keep the graph semantically valid, configuration options, and performance that holds up as your diagram grows. This demo directly addresses those challenges.
Live demo: https://www.jointjs.com/demos/ai-workflow-builder
The same engine powering this AI Workflow Builder also drives BPMN editors, industrial automation (SCADA/HMI), energy network visualization, circuit design, data modeling tools, and more. The domain might change, but the engine’s strengths remain the same. A workflow editor puts most of these capabilities to the test, making it the perfect starting point.
The diagram nodes in this demo (Input, AI Agent, Tool, Output) aren’t just rectangular boxes—they’re fully configurable UI components. Each node can render arbitrary HTML content, including headers, icons, text areas, select boxes, sliders, and other interactive controls. Combined with visual cues like colored icons and port legends, the graph remains easy to scan and understand at a glance.
// src/components/nodes/render-node.tsx

function NodeBody({ data }: { data: ConfigNodeData }) {
 switch (data.kind) {
   case 'input':  return <TextInputBody data={data} />;
   case 'skill':  return <SkillBody data={data} />;
   case 'agent':  return <AgentBody data={data} />;
   case 'tool':   return <ToolBody data={data} />;
   case 'output': return <OutputBody data={data} />;
 }
}Undo/redo, copy/paste, multi-select, keyboard shortcuts, snap-to-grid are all essential features users expect from serious apps. If you’ve ever tried building them from scratch, you know they’re far from easy to get right.
In this demo, history and clipboard are single props on the root component:
// src/app.tsx

<Diagram cells={cells} onCellsChange={setCells} history clipboard>
The real value isn’t just that these features exist, but that they work together seamlessly. Undo correctly reverses a paste, multi-select moves as a group and lands on the undo stack as a single action, while Snaplines (a JointJS feature for aligning elements) work no matter how a node was placed. Only a library that builds these features into the engine can guarantee they’ll play nicely together.
This is what matters in serious, production-grade applications, and in JointJS+ for React, the diagram state is plain React state. Just as you’re used to working with React, Diagram can take data in either uncontrolled or controlled state. This demo showcases the controlled state.
// src/app.tsx

const [cells, setCells] = useState<readonly WorkflowCell[]>(INITIAL_CELLS);

<Diagram cells={cells} onCellsChange={setCells} history clipboard />
The controlled cells array is the single source of truth. It’s rendered on the <Diagram />, while every user action fires onCellsChange with an updated array. Because the graph is just a serializable data structure, saving, loading, and processing are trivial.
Note that the state hooks in JointJS for React behave identically in JointJS and JointJS+, but in JointJS+, GraphProvider becomes Diagram, which also gives you access to selection, history, clipboard, spatial index, and more.
Diagrams that developers create by hand often drift toward visual noise. The auto-arrange option resolves this in a single action, in which a layout algorithm runs over the graph and repositions every node cleanly.
At the canvas/paper level, there are two available modes: an infinite-scrollable canvas for open-ended building, and a fixed sheet mode that restricts the diagram's canvas to specific, page-like boundaries, which is ideal for exportable documents such as flowcharts, organization charts, or diagrams that must fit strict corporate reporting templates.
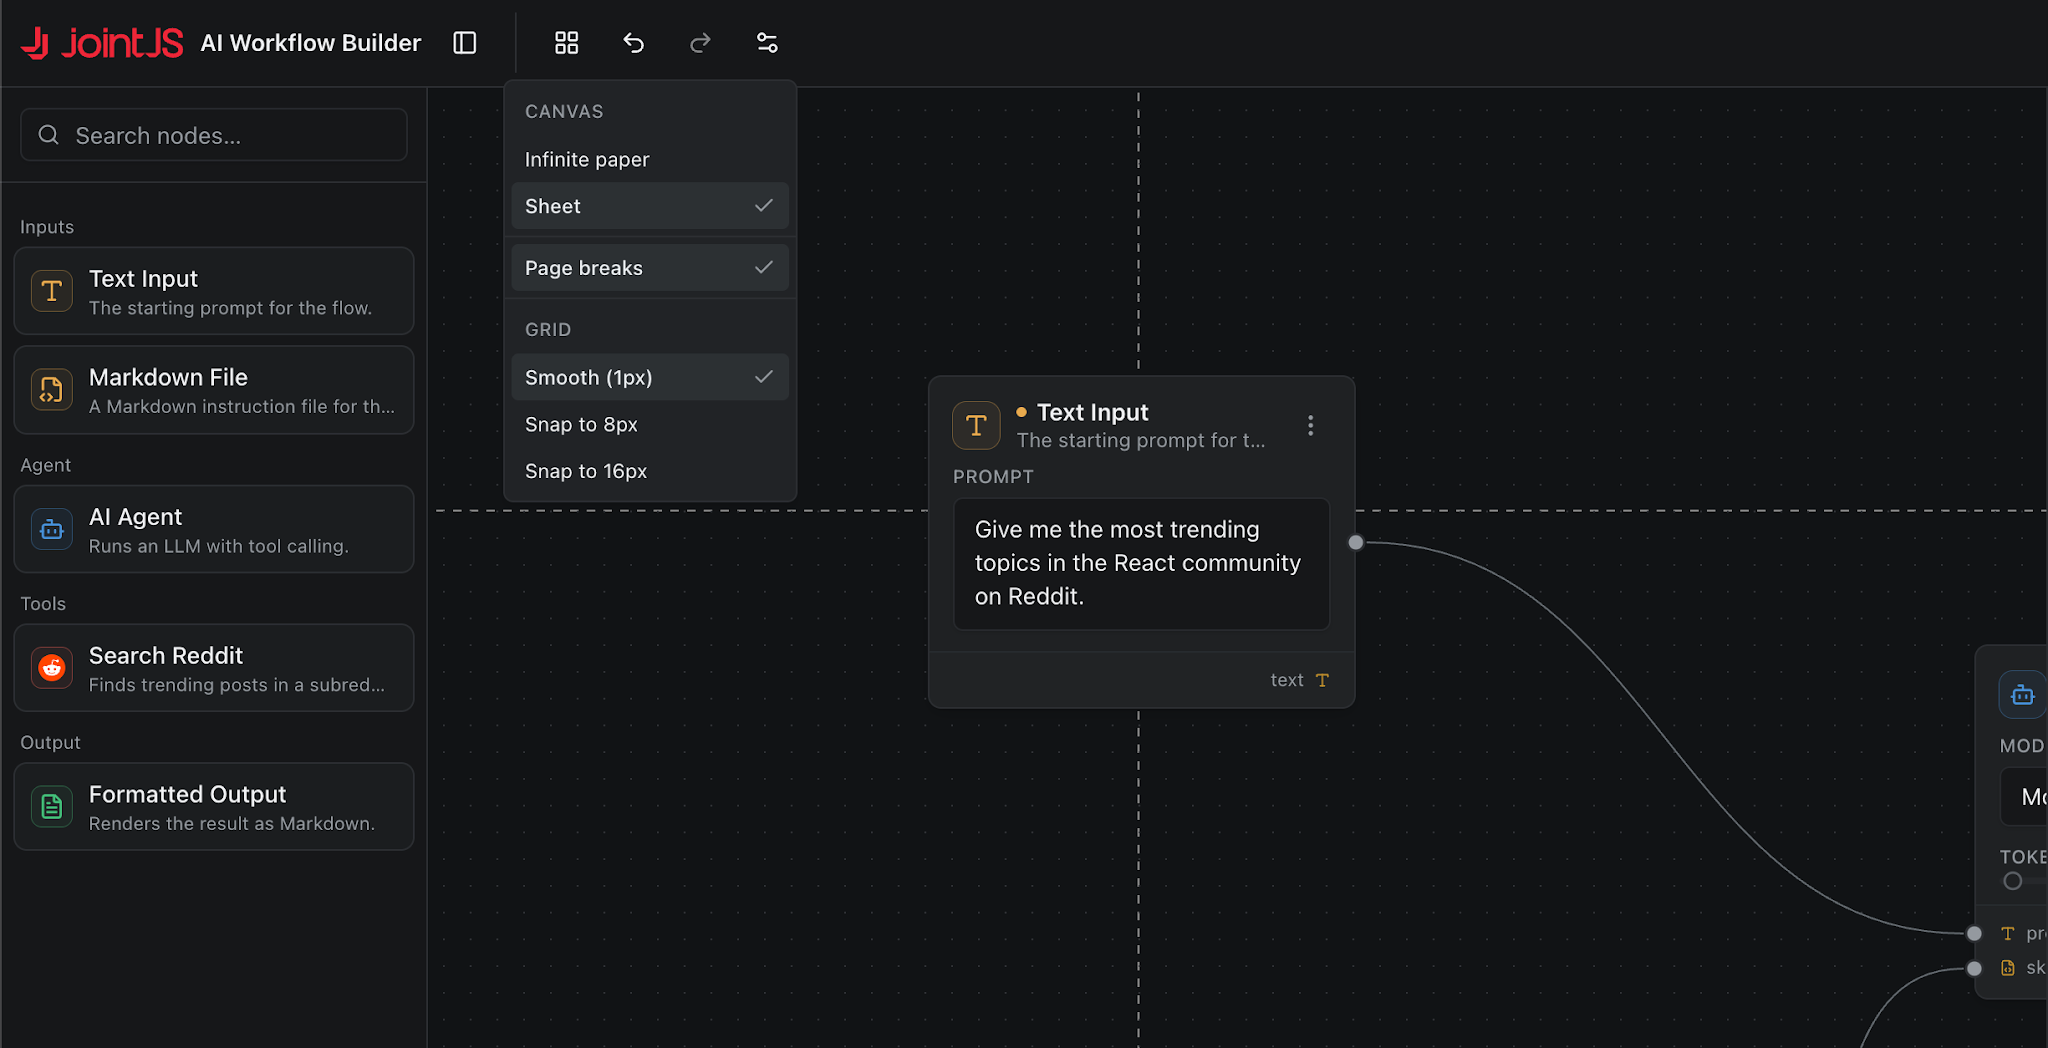
The minimap in the bottom-right corner becomes vital as soon as the diagram grows beyond the viewport size. In JointJS+ for React, this is just one of the components you can plug into your application with a few lines of code.
This demo clearly demonstrates what a serious AI workflow editor looks like when it’s built on a complete diagramming engine.
Every feature shown here, from typed connections, undo/redo, clipboard, multi-select, auto-layout, export, to minimap, is available on day one as a core feature of the JointJS library.
JointJS handles the hard parts out of the box, so you can focus on building your application logic instead of spending months implementing core library features.
JointJS+ for React provides a valuable set of features for production-ready diagrams, not just demos. These capabilities make JointJS+ for React a true foundation for serious diagramming applications, eliminating the need to reinvent critical features and assuring your product is ready for actual real-world demands.
JointJS uses a combination of SVG and HTML as its rendering engine, which means your diagrams will remain crisp at any zoom level, while the added benefit of SVG being accessible means your applications will meet necessary accessibility standards more easily.
On top of that, in JointJS you’re never limited to built-in shapes. You can easily create any kinds of elements. Nodes can use SVG or HTML, with wrapped labels, interactive inputs, and live data. All JointJS elements work flawlessly with ports, links, and selection, so you’ll never have to resort to workarounds.
JointJS comes with extensive options that let you configure it for scalability and performance, but it ships with conservative defaults, primarily for backward compatibility. JointJS+ for React, on the other hand, doesn’t come with this baggage, so all advanced JointJS performance options like async, autoFreeze, and viewManagement you’d want in a large-scale application are enabled by default.
All of this means that instead of thinking about what you need to do to make your large apps performant, you can just start building with confidence, knowing that everything is already set up for you, even if you plan to build diagrams with thousands of nodes.
JointJS+ for React is built to deliver a frustration-free diagramming experience for both end users and developers. The library provides intuitive drag-and-drop interactions, smooth editing, instant feedback, and advanced features such as minimap, smooth zoom controls, different routers, and more.
Get fully featured, standards-compliant shapes for BPMN 2.0, value stream mapping, data modeling (records/tables), and charts.
These shapes aren’t just icons, but they include the correct ports, labels, and connection rules for each domain, allowing you to build real-life applications without starting from scratch.
JointJS+ for React comes with built-in tree, force-directed, grid, and stack layouts, while also allowing seamless integration with advanced third-party layout engines such as ELK and Dagre. Easily auto-arrange and reorganize complex diagrams.
These algorithms make it easy to auto-arrange nodes, keep diagrams readable, and adapt to model changes, saving you weeks of custom development.
Undo/redo, copy/paste, multi-select, keyboard shortcuts, snap-to-grid, and alignment guides work together out of the box, intuitively.
None of these are bolted on separately and hoped to cooperate: undo correctly reverses a paste, a multi-select move lands on the undo stack as a single action, and snap-to-grid/alignment guides apply no matter how the node got there, be it by dragging, pasting, or dropping it from the stencil.
The API features complete, first-class TypeScript definitions. From connection validators to custom shapes and serialized cells, everything is strongly typed, allowing autocomplete to work out of the box while giving you the opportunity to catch errors at compile time, making maintenance and refactoring much safer.
In JointJS+ for React, you can easily export diagrams as SVG, PNG, or PDF. What users see on screen is exactly what they get in exports, so you won’t need to implement separate rendering logic. Canvas (paper) options allow you to visualize fixed sheets and page breaks, which is key if you need specific dimensions of diagrams and flowcharts for your documents and presentations.
JointJS+ for React is designed for teams building workflow automation tools, BPMN modelers, data pipeline editors, network topology visualizers, circuit design tools, or any application where diagramming is a core product feature. It’s built for cases where users need robust editing, undo/redo, easy export, and all of this delivered with polished UX and production-grade scalability. When your requirements go beyond simple visuals, and you need a complete, production-ready foundation, JointJS+ for React delivers everything out of the box.
Simpler libraries are fine for simple needs, but as soon as requirements get serious, whether in performance, intuitive and accessible UX, scalability, or configuration options, you quickly hit a ceiling. At that point, you either have to build the missing pieces yourself or start with the right foundation from day one. Not anymore, because this is precisely the gap that JointJS+ for React fills.
The easiest way to get started with JointJS+ for React is to jump into our AI Workflow Builder demo. The source is fully available on GitHub, so you can clone the repo, run npm install, and you’re ready to tweak and customize it, either by hand, if you want to dig into the code yourself, or with your AI Coding Agent, be it Claude Code, Codex, Cursor, or any other model you might be using.
All the principles that apply to AI Coding Agents and JointJS also apply to JointJS+ for React. That means you can use your AI Coding Agent and the AI Workflow Builder demo as a great starting point for your own proof of concept, or even project. The documentation is already up to date, so our JointJS MCP Server will help you get started right away, without having to wait for new AI training sets to kick in.
Happy diagramming! 👋


.png)