The diagramming library for building energy network UIs

Substations, feeders, and transmission corridors aren't just nodes and edges — they have terminals, voltage levels, and operational state. JointJS gives grid software teams the building blocks to model that fidelity in production UIs.
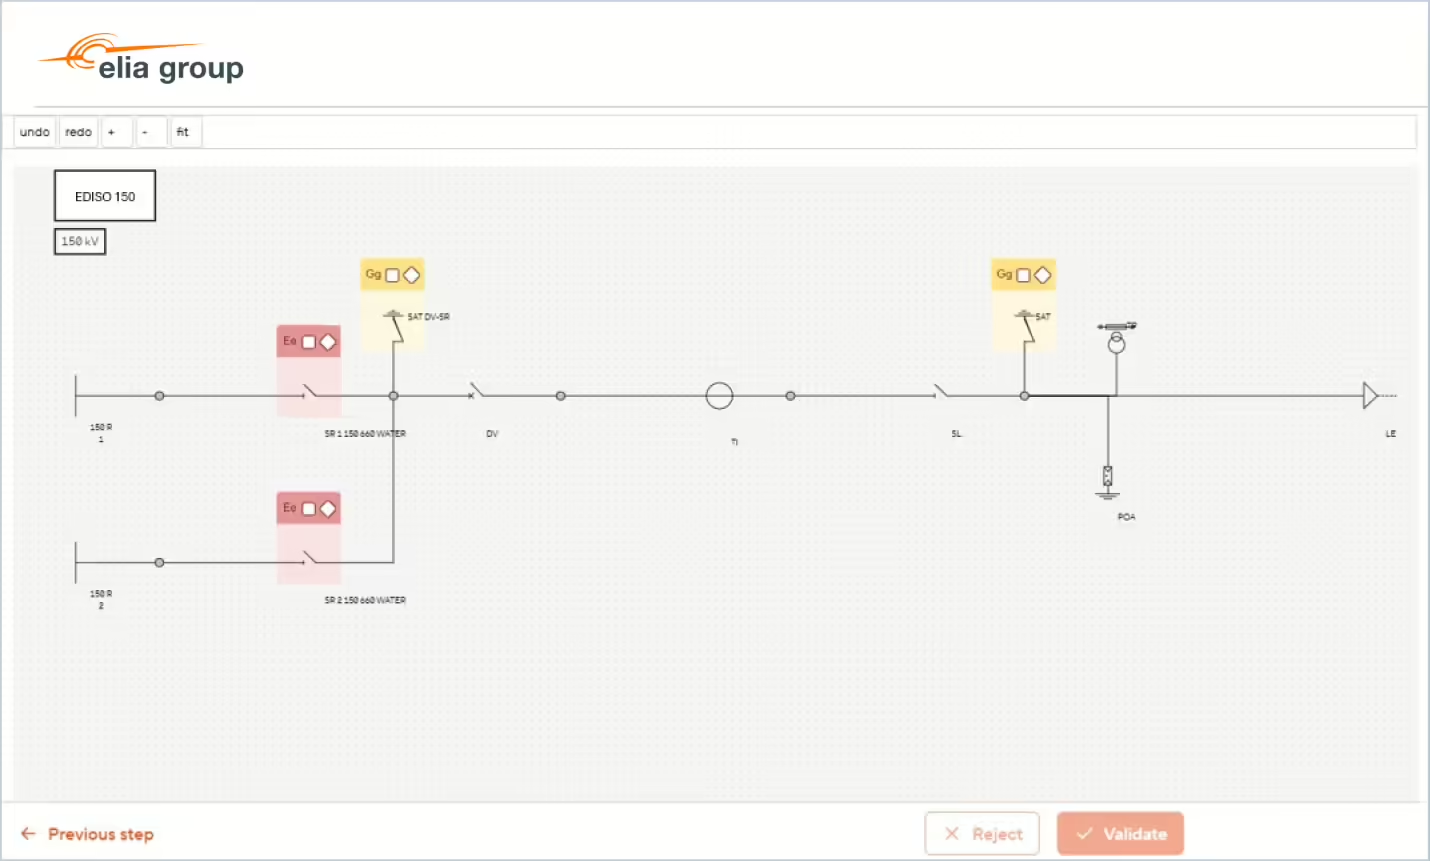
Diagram built using JointJS
Use cases

What grid software teams build with JointJS

From substation documentation to grid planning and energy reporting — the underlying requirement is the same: a canvas that understands electrical topology, not just shapes and connectors.


Single-line diagrams (SLDs)

SLDs demand strict notation (IEC 60617, ANSI) and pixel-accurate symbols for breakers, transformers, and busbars. JointJS is SVG-based — symbols stay vector-perfect at any zoom, with no rasterization fallback.

Grid topology and planning tools

Planners model full networks to run load flow, short-circuit, and N-1 studies. JointJS handles canvases with thousands of buses and branches per view while staying responsive under heavy interaction.

Energy flow and balance dashboards

Generation mix, cross-border flows, ENTSO-E reporting. JointJS drives sankey-style and schematic visualizations from live operational data — edge widths, colors, and labels bound to real values.

DER and microgrid design

Solar, storage, EV charging, VPPs. VPP operators, microgrid designers, and behind-the-meter platform vendors need to render electrical topology and control hierarchy in the same canvas. JointJS handles both without forcing the model into a single layer.
customer story

Trusted by global leaders

“JointJS allowed us to quickly develop a tool to generate single-line schematics for our network and easily integrate it into our permit management tool. We also plan to integrate it into another tool in the near future because it offers more functionality and flexibility.”
Damien Vanvrekom
Program Manager
See customer story
Features

What JointJS+ gives you out of the box

Remote troubleshooting

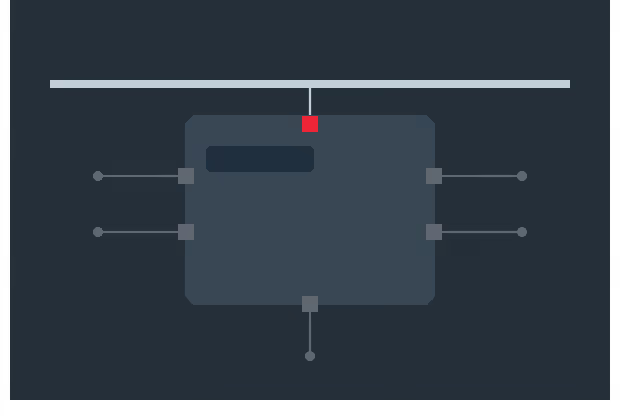
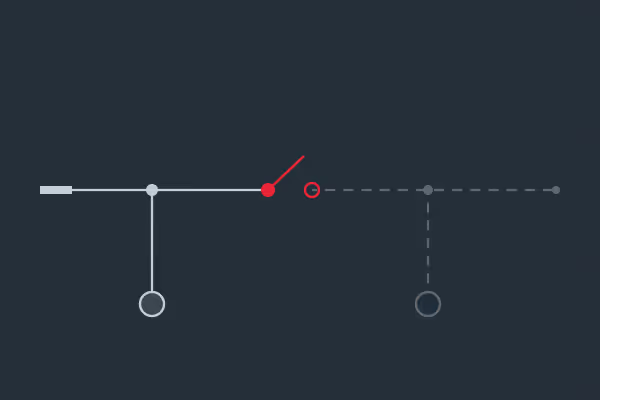
Terminal-level connections

Model busbars and equipment terminals as semantic connection points, each with a name and a defined meaning, rather than generic spots on a shape. Required for accurate substation representation and protection scheme diagrams.
Remote troubleshooting

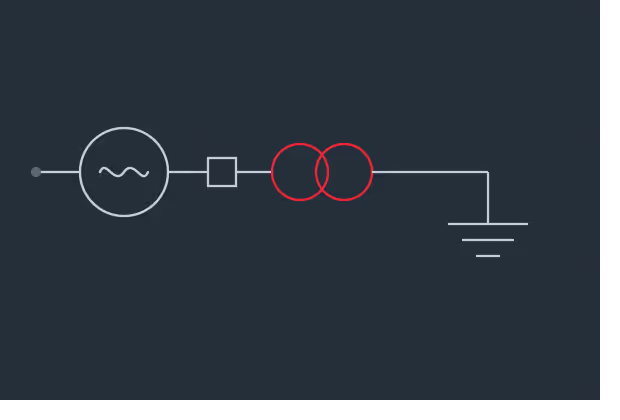
IEC 60617 / ANSI symbol fidelity

Full SVG authoring of switchgear, transformer windings, generator symbols, and grounding notation. No raster fallbacks.
Remote troubleshooting

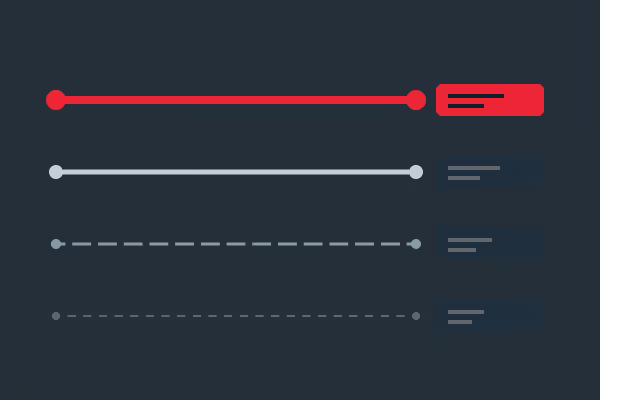
Voltage-level encoding

Drive line styling (color, thickness, dash pattern) from voltage class via JointJS's attribute binding.
Remote troubleshooting

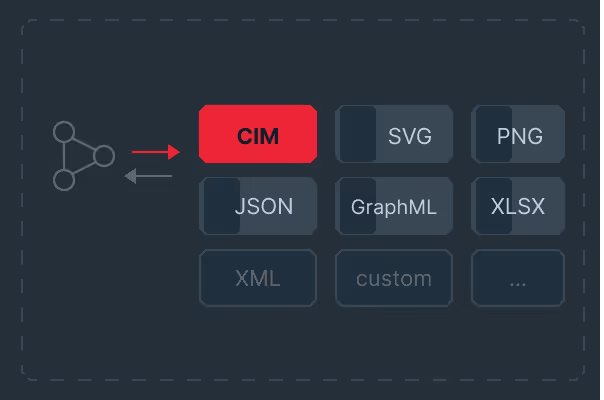
CIM and structured data binding

Sync the canvas with a CIM (IEC 61970/61968) model, GIS export, or planning database through JointJS's graph model and event API.
Remote troubleshooting

Topology operations

Implement switching, sectionalizing, and energization logic on top of JointJS's graph API. Trace connectivity, find islands, follow feeders programmatically.
Remote troubleshooting

Performance at grid scale

National transmission networks span tens of thousands of elements. JointJS provides viewport culling, level-of-detail rendering, and async layout to keep canvases interactive at scale.
Remote troubleshooting

Export and embed

SVG and PNG export for engineering reports, incident documentation, and regulatory filings.
Remote troubleshooting

Framework-agnostic

Integrates cleanly with React, Angular, Vue, and Svelte applications.

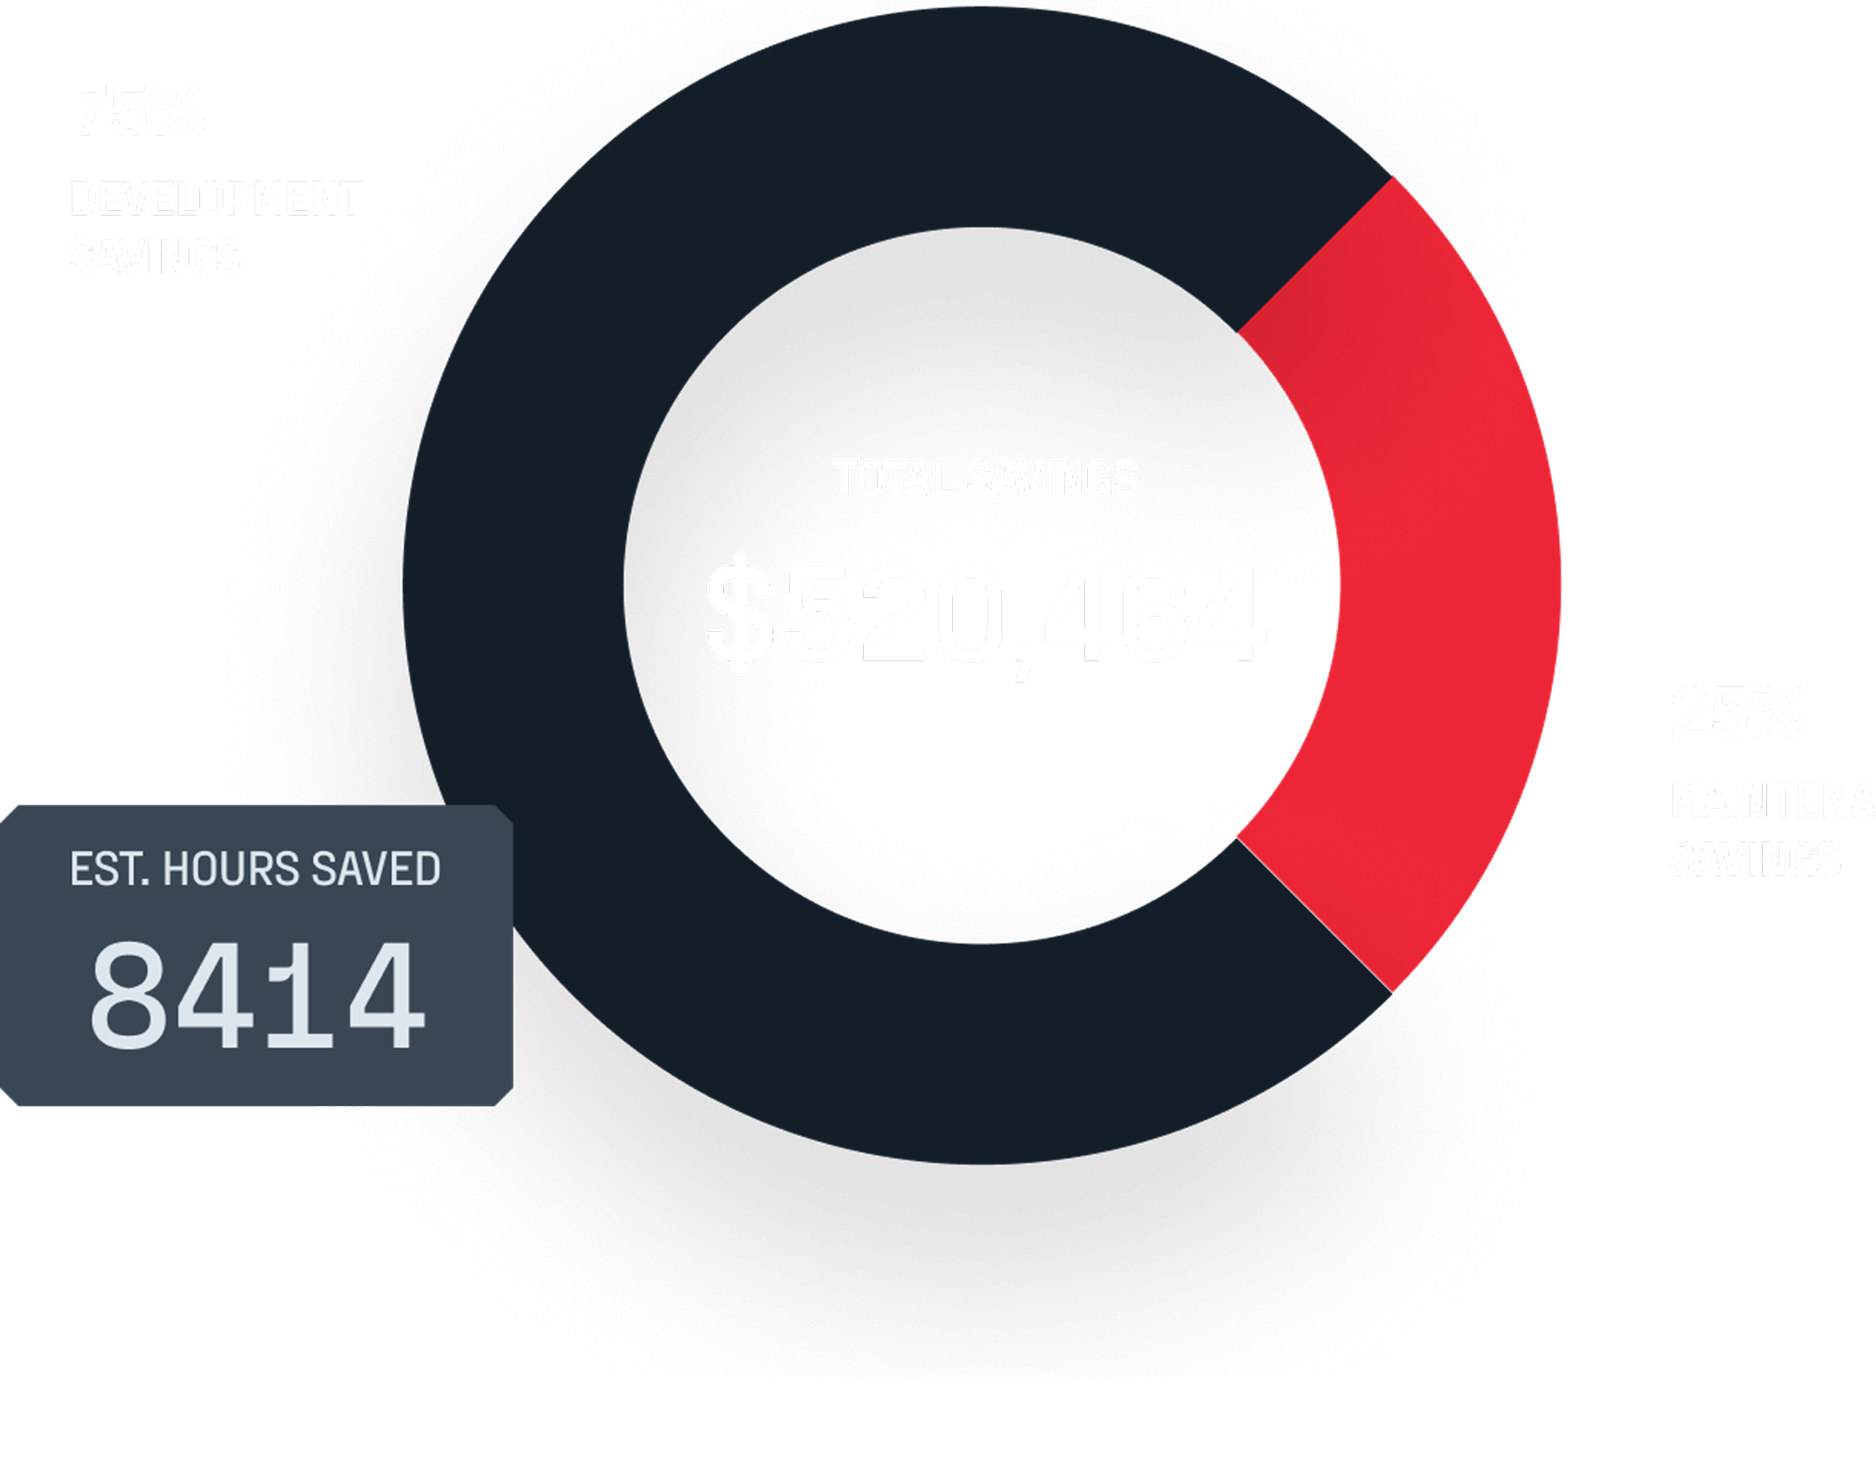
ROI analysis: See how much JointJS+ saves you

Social proof

What engineering teams say

I worked with JointJS+ on different projects to build graphical editors and it helps me get off the ground quickly. Most of the features that you know from other modern editors, even the more advanced ones, are prebuilt in the framework and can be enabled with just a few lines of code. All other features can be added easily due to the framework‘s open nature. And if you get stuck, they provide excellent technical support where you can get in touch directly with the creators of the framework.
Andreas Mülder
Team Leader, Itemis
JointJS+ allowed CELUS to focus all our efforts on developing our core technology, while still providing our users with a great diagramming experience. The library is fast to integrate and comes with a wide set of advanced features out of the box that saved us countless development hours. A great partner to have!
Rui Calsaverini
Engineering Director, CELUS GmbH