Have you ever wondered how performant enterprise-grade diagramming libraries actually are?
In this article, you'll see JointJS stress-tested using a vibe-coded YouTube Channel Visualizer with no performance optimizations, gradually scaling up to over 11,000 DOM elements. Then, you'll discover what happens when performance optimization techniques are applied to a JointJS app.
Spoiler alert: diagrams with 100,000 nodes are no problem for JointJS.
JointJS uses SVG as its rendering engine. This is a deliberate choice because SVG is accessible by default and provides a real DOM tree with elements you can target, inspect, and style. Additionally, contrary to popular belief, Canvas doesn’t always outperform SVG, particularly in cases with a small number of objects or over a large surface area.
Throughout this article, DOM elements are counted as a proxy for diagram complexity because, in JointJS, they often correspond directly to diagram nodes and links.
The trade-off is that SVG performance may degrade if tens of thousands of elements are all rendered at the same time. Fortunately, JointJS has a built-in viewport matching algorithm and efficiently re-renders as the user interacts with the diagram , moving/scaling the viewport, so the entire diagram doesn't need to be rendered. Additionally, there's a performant workaround even for cases where you need to show tens of thousands of elements simultaneously, which will be covered at the end.
The performance tests we’ll run will be done on the YouTube Channel Visualizer, an app built on the open-source version of JointJS that displays a YouTube channel as an interactive canvas. Each video appears as a card, and you can drag them around and view connections between dates, tags, and related videos.
In the initial app state, there are 9 videos on the canvas, and every video is connected to a date, month, and year node. It looks simple, but in DevTools, the SVG tree tells a different story:
document.querySelectorAll('svg *').length;
// 647
There are 647 DOM elements on the paper canvas that the app renders. Everything is fluid and smooth. Dragging cards, panning, and zooming all perform seamlessly. Measuring performance in the Performance Panel of the Chrome DevTools confirms this. There are no dropped or partially-rendered frames in the recording.
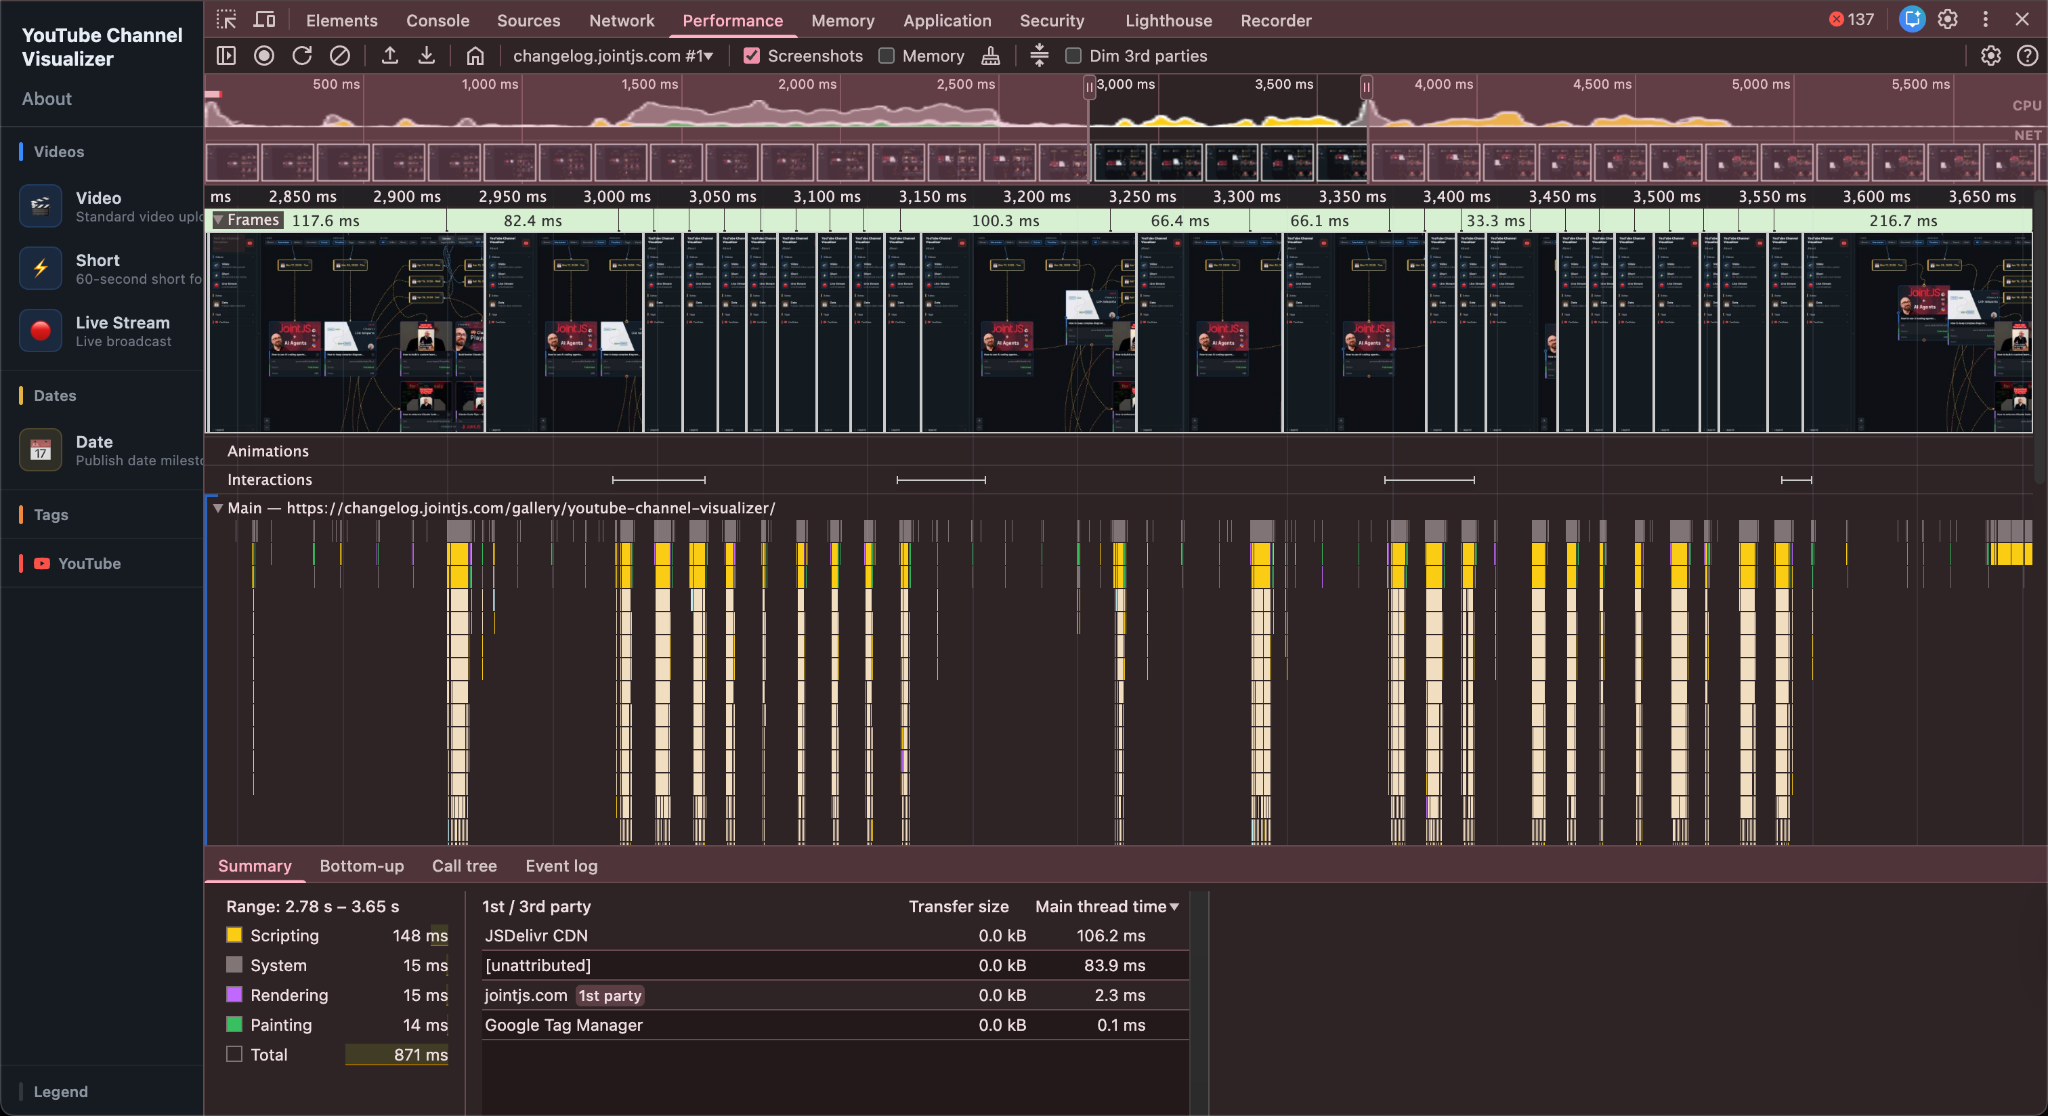
Next, all 16 videos from the JointJS YouTube channel were loaded onto the same canvas. The diagram continues to perform smoothly, and the DOM element count climbs to 1,156 elements.
The performance recording shows everything green, with a random yellow “partially presented frame.” It’s more than likely that a user doesn’t even notice the partially-rendered frames, especially when they’re sparse.
However, this scenario still doesn't represent large-scale enterprise usage. For the next tests, the YouTube Channel Visualizer was loaded with 100 and 170 videos, respectively.
Diagram with 100 video cards:
Diagram with 170 video cards, and hundreds of links between elements:
With over eleven thousand DOM elements and no tuning, the app remains well within “respectable” performance territory.
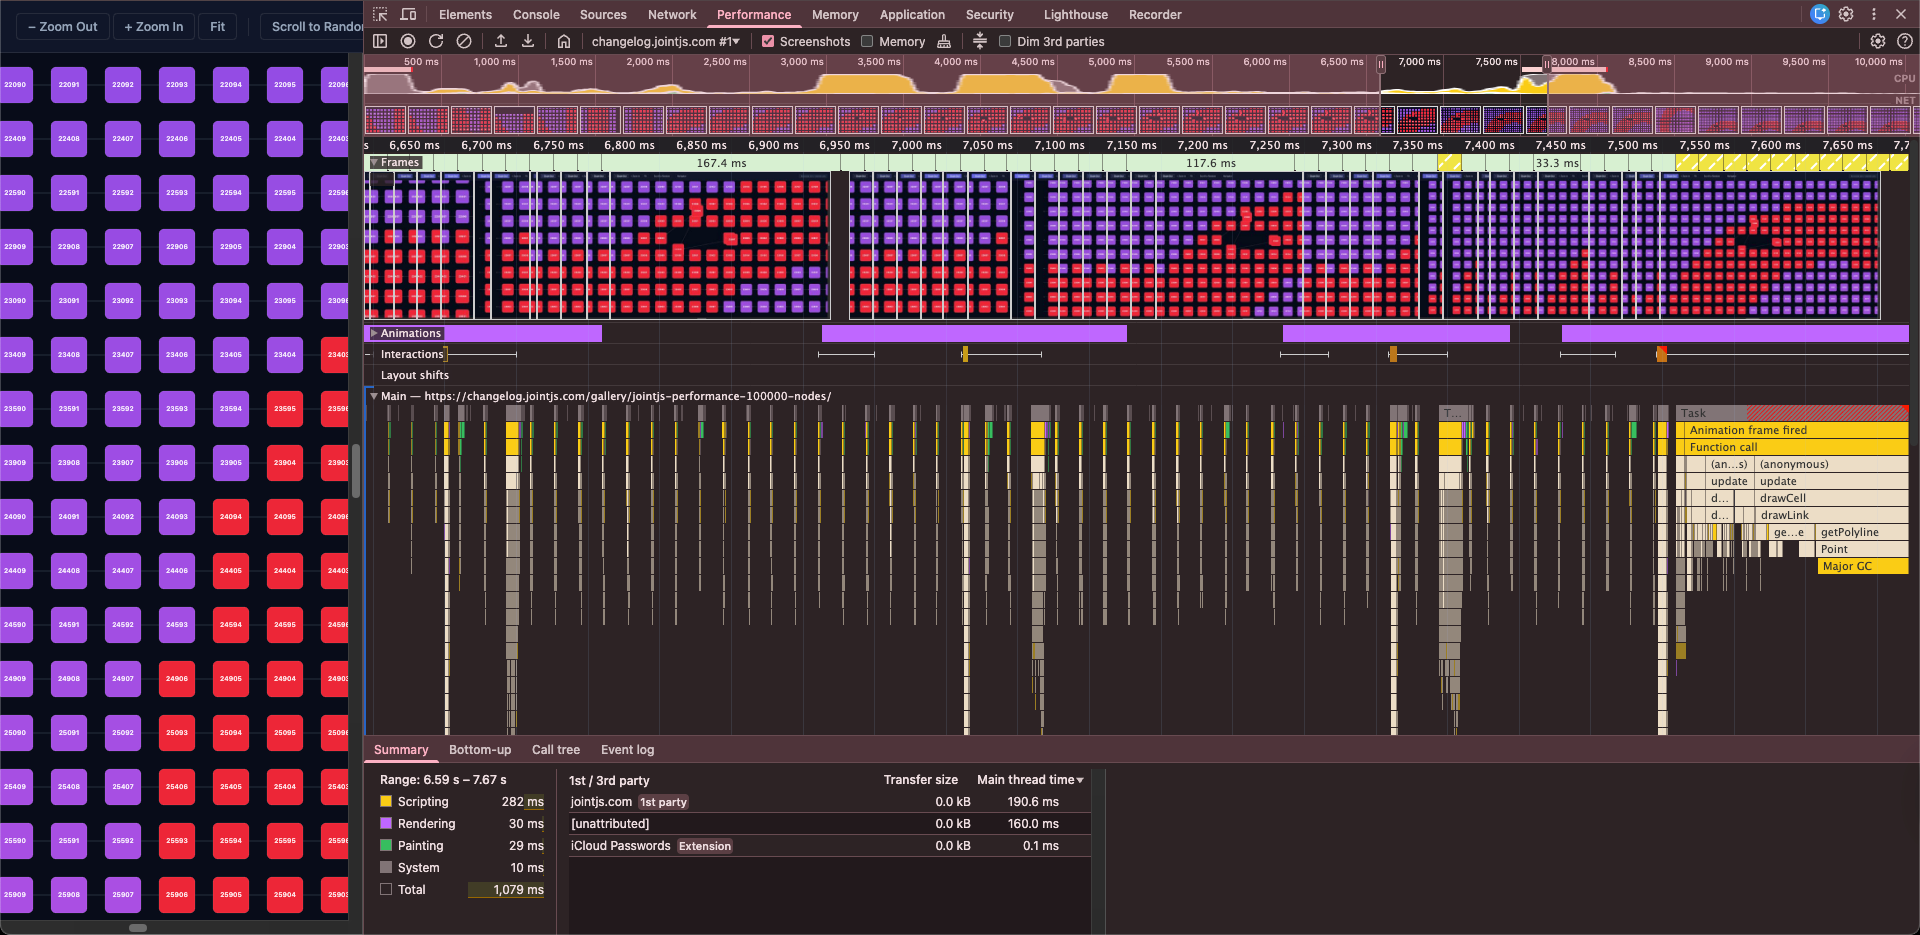
The final test loads 100,000 cells onto a single canvas, simulating an enterprise-scale use case.
If we apply JointJS performance optimization techniques, such as enabling virtual rendering and view management, only the visible cells will be rendered, so the diagram can stay responsive and fluid even at exceptionally large scales.
Diagram with 50,000 cards and links between them:

At a certain point, if you zoom out far enough to show thousands of elements, SVG starts to lag. A solution implemented in the demo is automatic switching of the rendering layer from SVG to canvas. That way, you get the best of both worlds: SVG’s accessibility and interactivity when you’re up close, and the raw speed of canvas when you’re looking at the big picture.
The bottom line, based on the test performed, is this:
If you’re evaluating diagramming libraries where performance matters, specifically for complex apps with hundreds of elements that go beyond basic diagrams, JointJS can handle even the most demanding use cases.
Happy diagramming!


.png)