
.png)

If you want to visualize your YouTube channel, whether to gain more insight into channel metrics or simply to showcase your content on social media, a flat list of uploads or a screenshot from the analytics screen is quite limiting.
That’s the idea behind this YouTube Channel Visualizer, a lightweight online app that turns any YouTube channel into a visual diagram. It helps you explore videos, spot publishing patterns, analyze performance, and even plan future content.
In this post, you’ll see what the tool does, why JointJS is a strong fit for this kind of interface, and how this approach can help you build similar tools with AI Coding Agents such as Claude Code.
At its core, the YouTube Channel Visualizer displays the latest videos from a YouTube channel as a dynamic, interactive graph.
On the main canvas, you can:
The tool currently supports several ways to view your channel:
That flexibility makes the tool useful not just for browsing content, but for understanding it from different angles.
One of the most useful aspects of the app is the way it displays relationships among content elements.
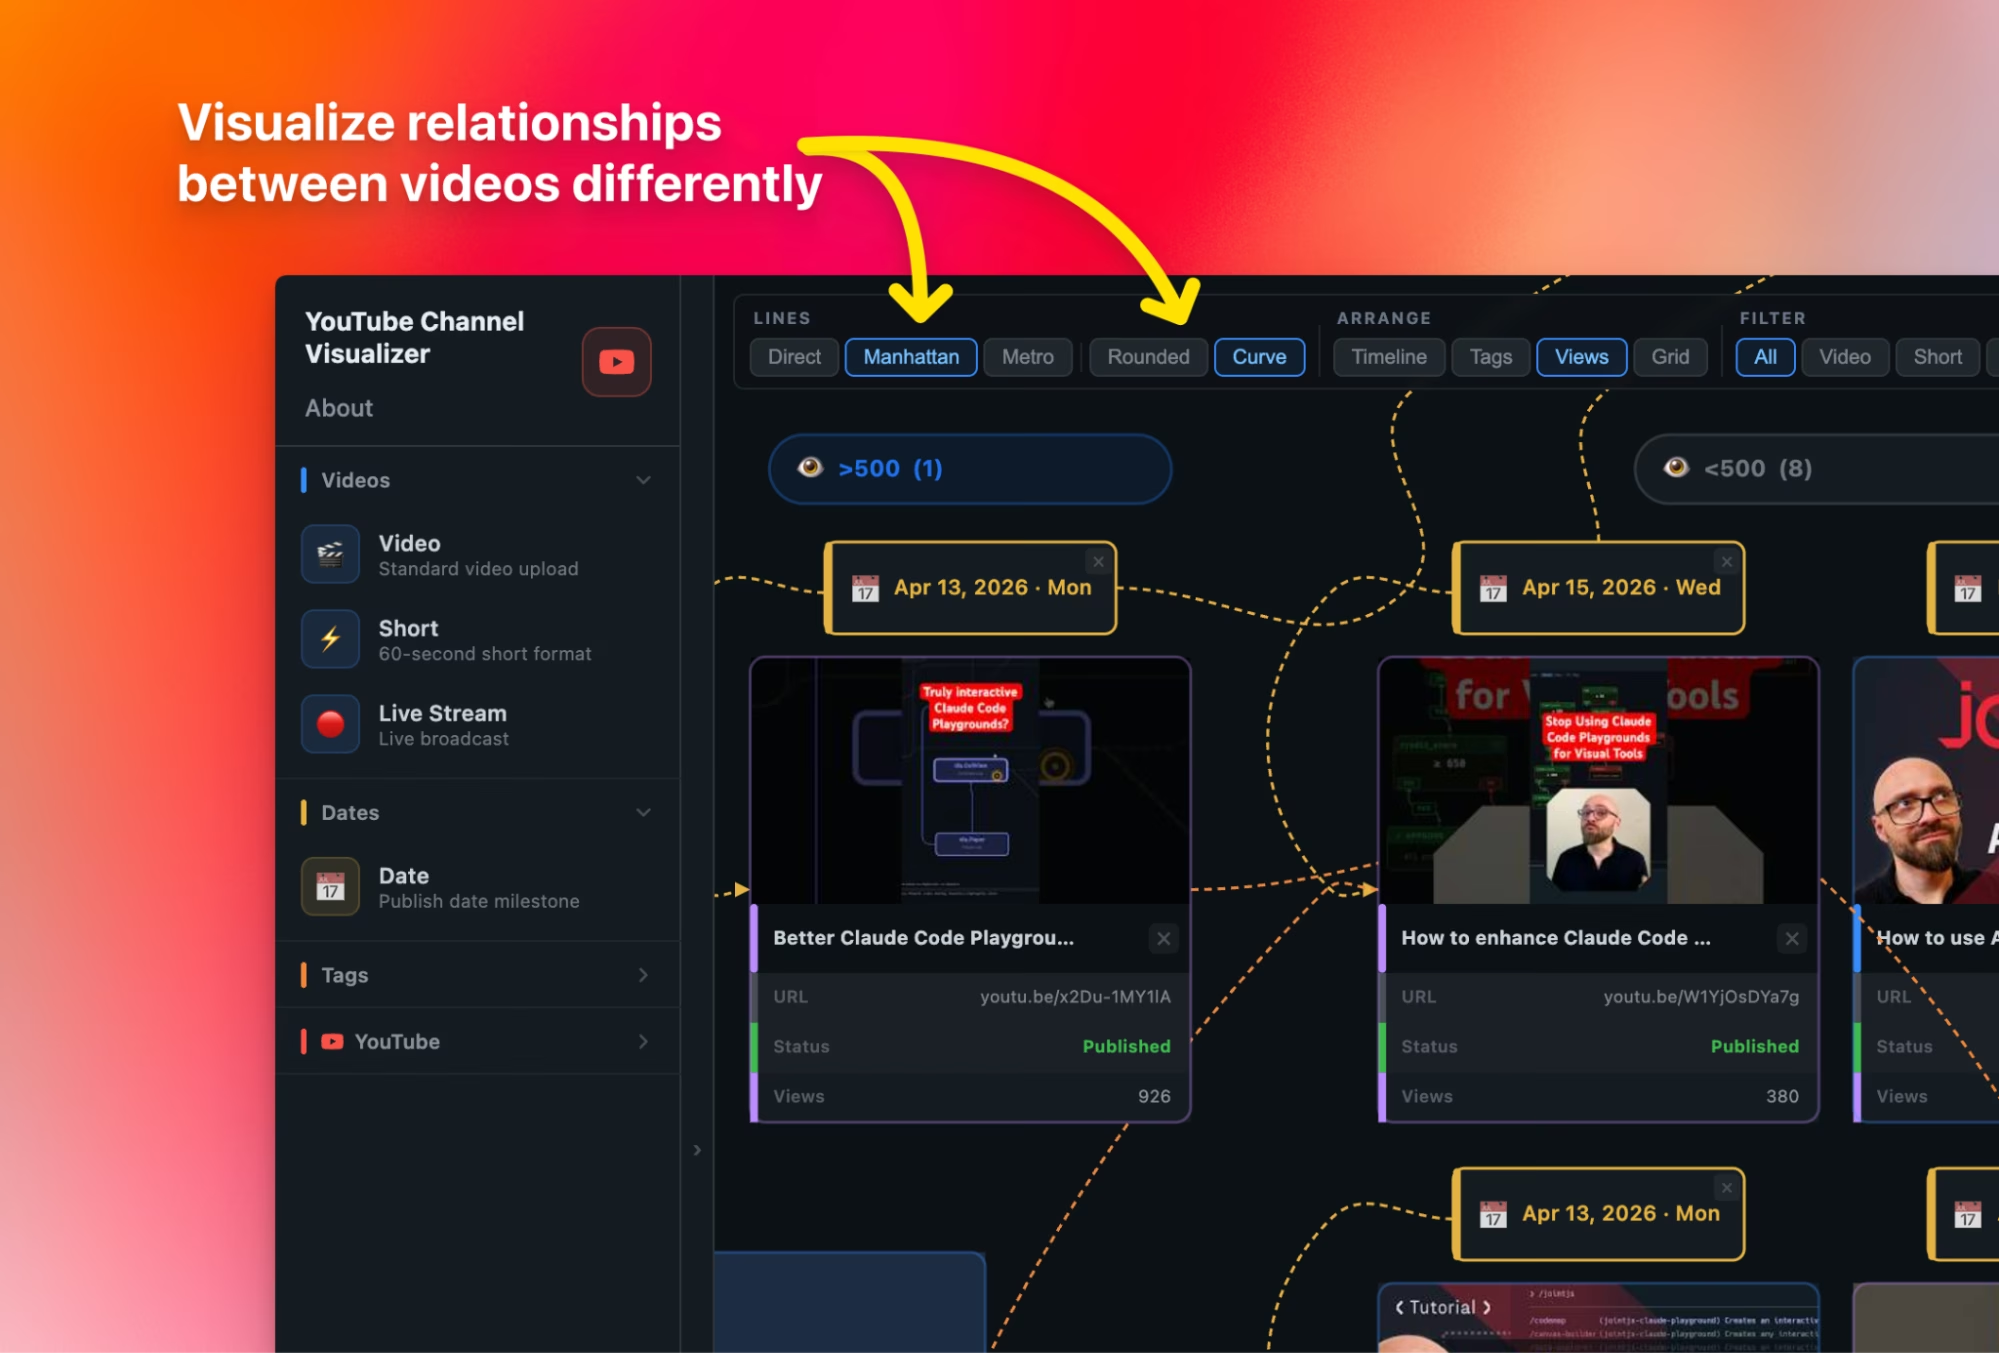
Connections between nodes can use different routing styles:
The lines can also use different visual styles:
These options, powered by the JointJS diagramming library, help shape the diagram’s readability and feel. A direct line works well for straightforward layouts, while routed or curved lines can make denser views easier to scan.
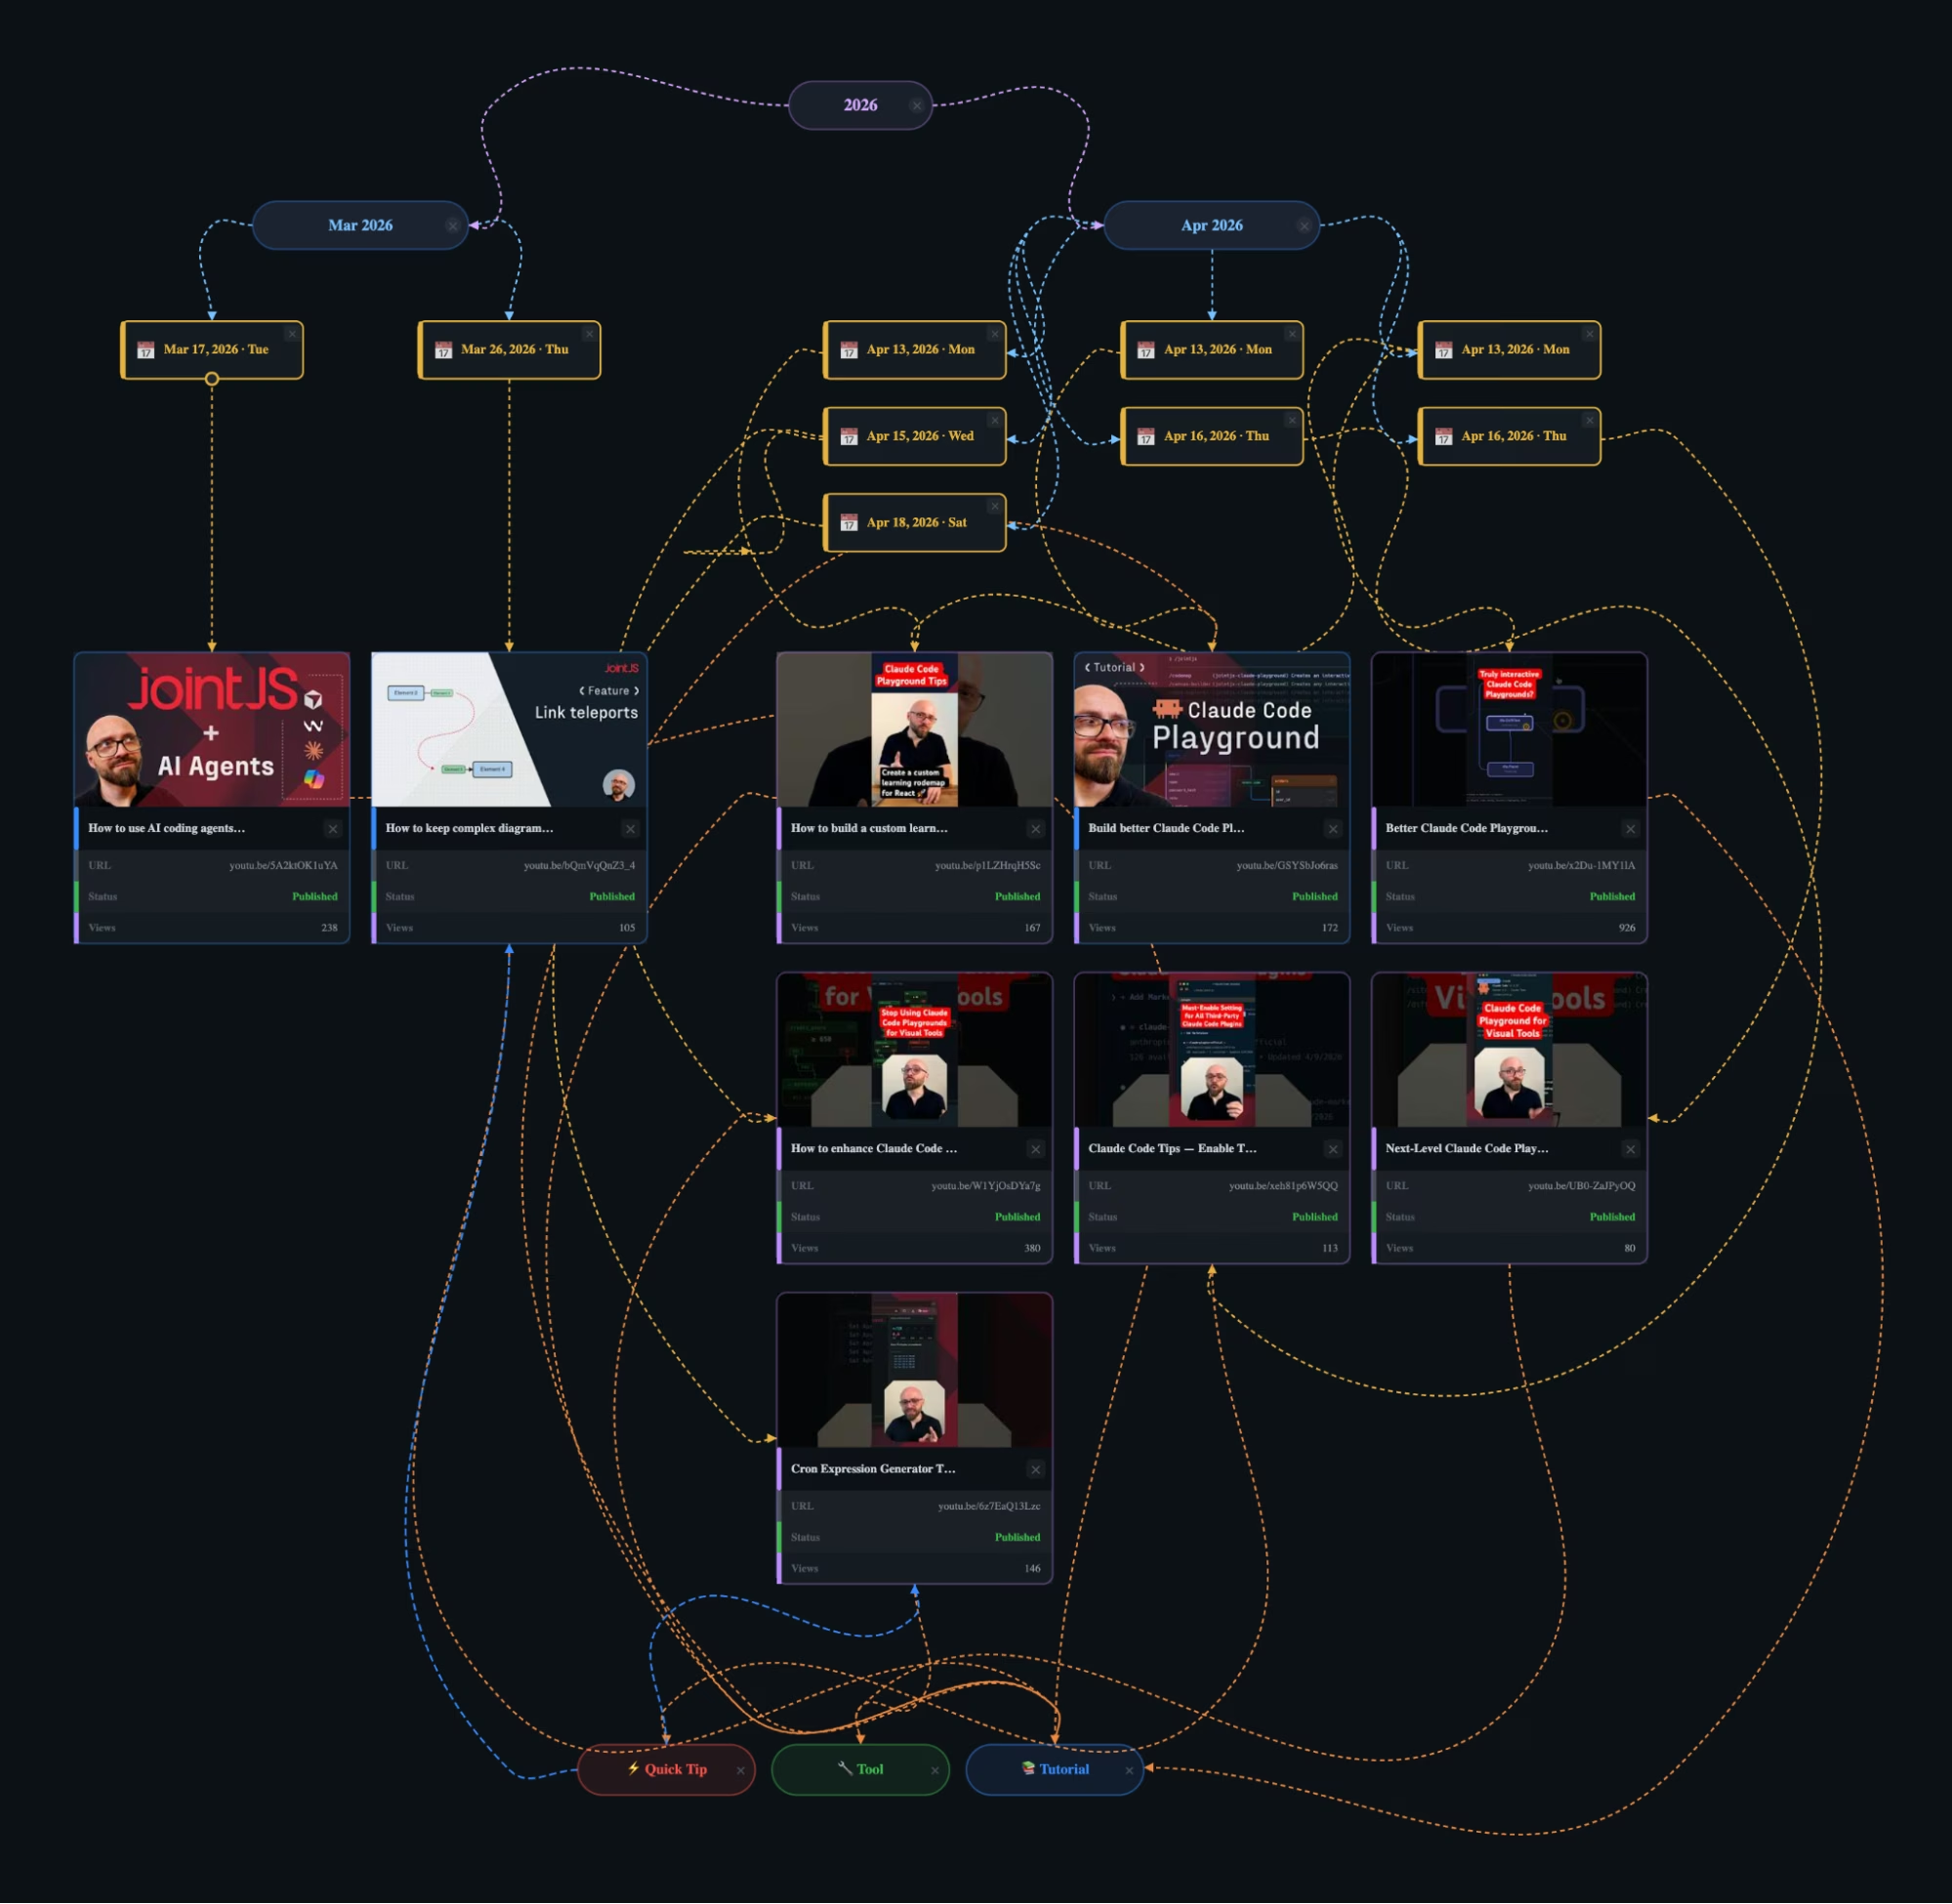
The canvas view showcases a card for each video on the channel, linking each to tags and dates and making the connections between different pieces of content easy to understand.
But the real value of the tool comes from being able to regroup the same data in different ways.
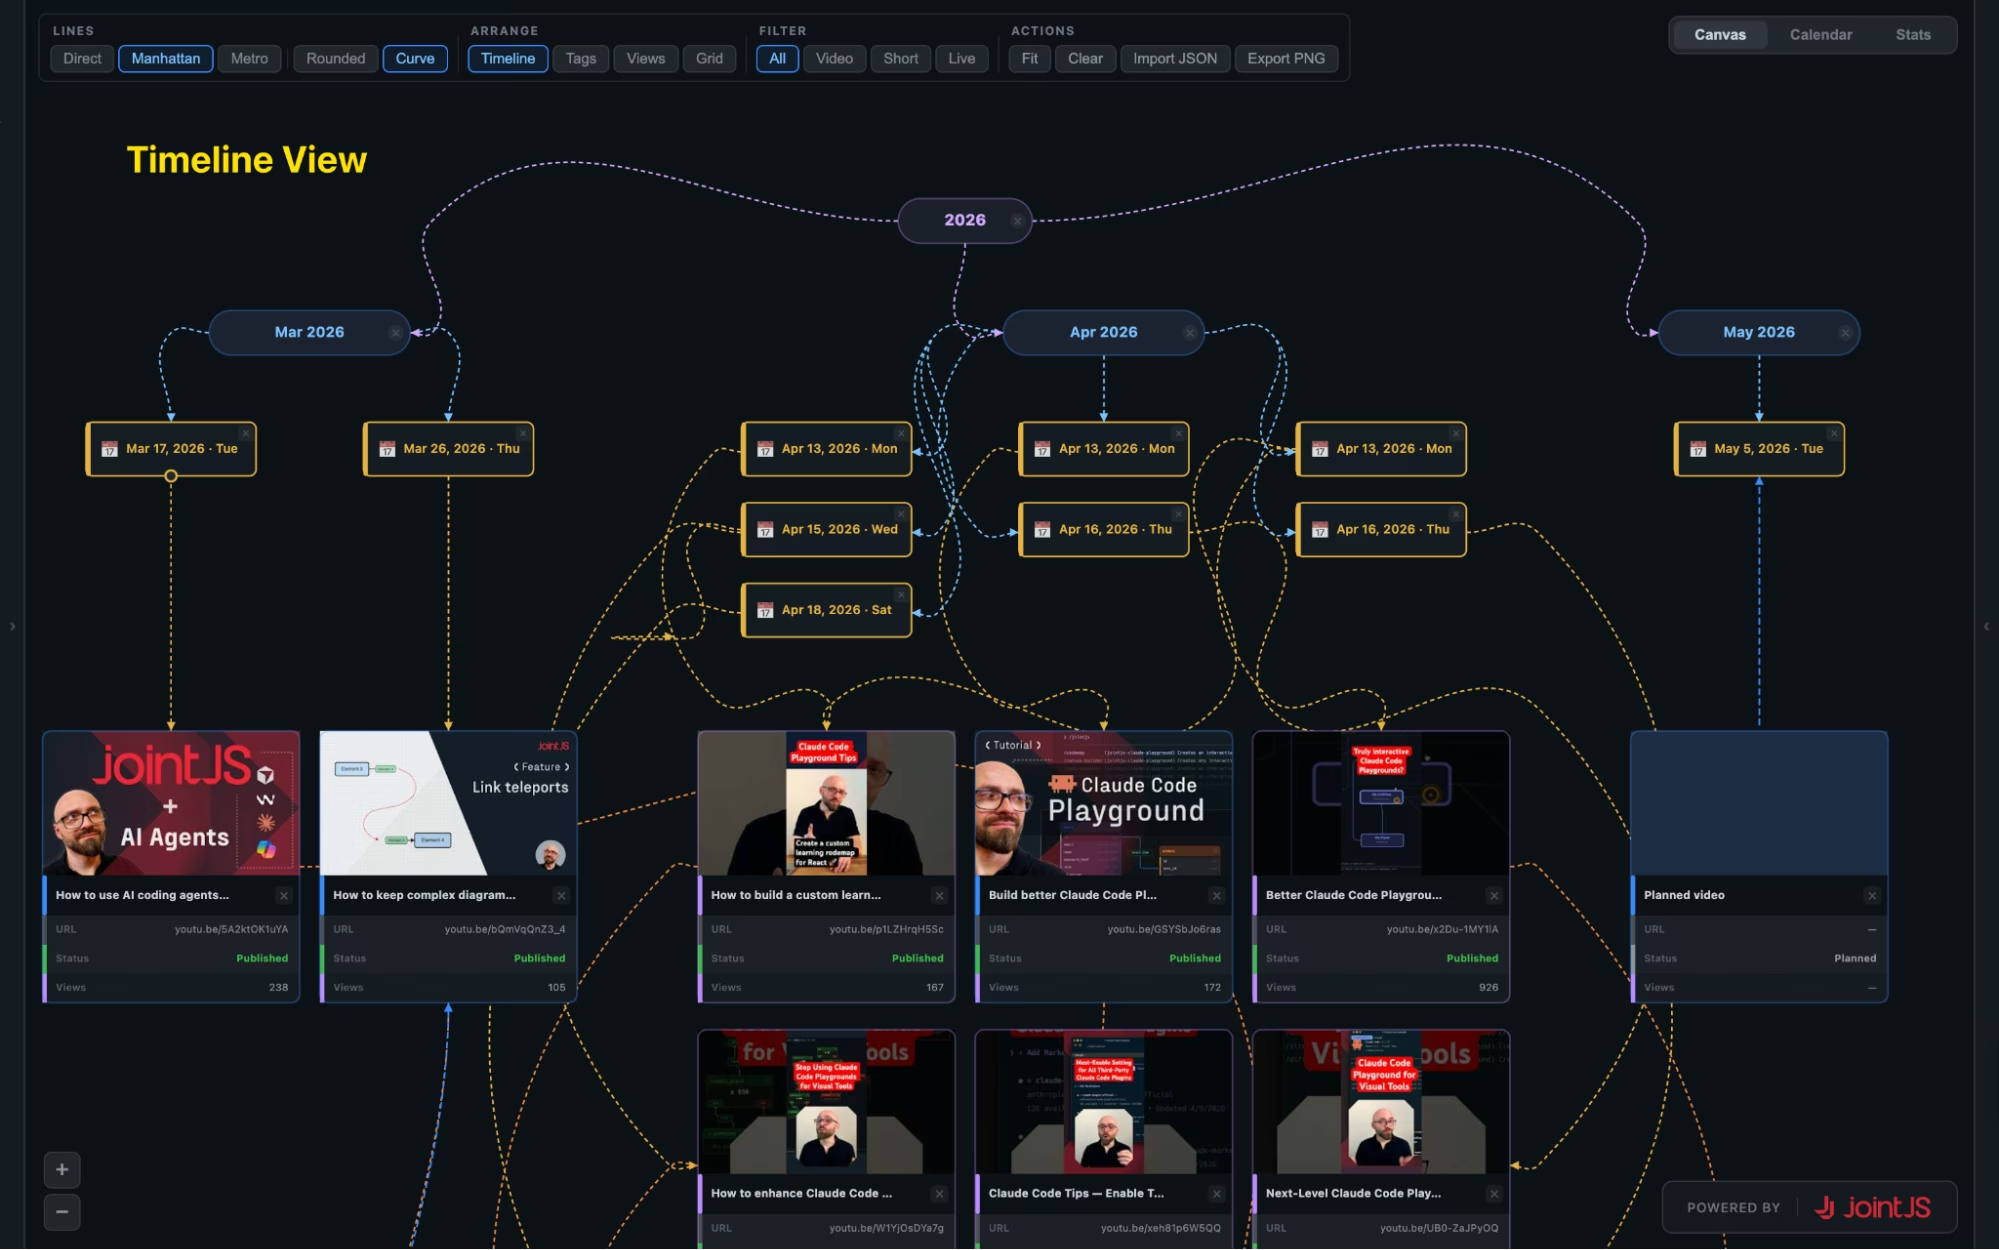
The Timeline view on Canvas is the default. It groups content by month, allowing you to see the distribution of videos over time and understand how publishing activity may relate to overall channel performance.
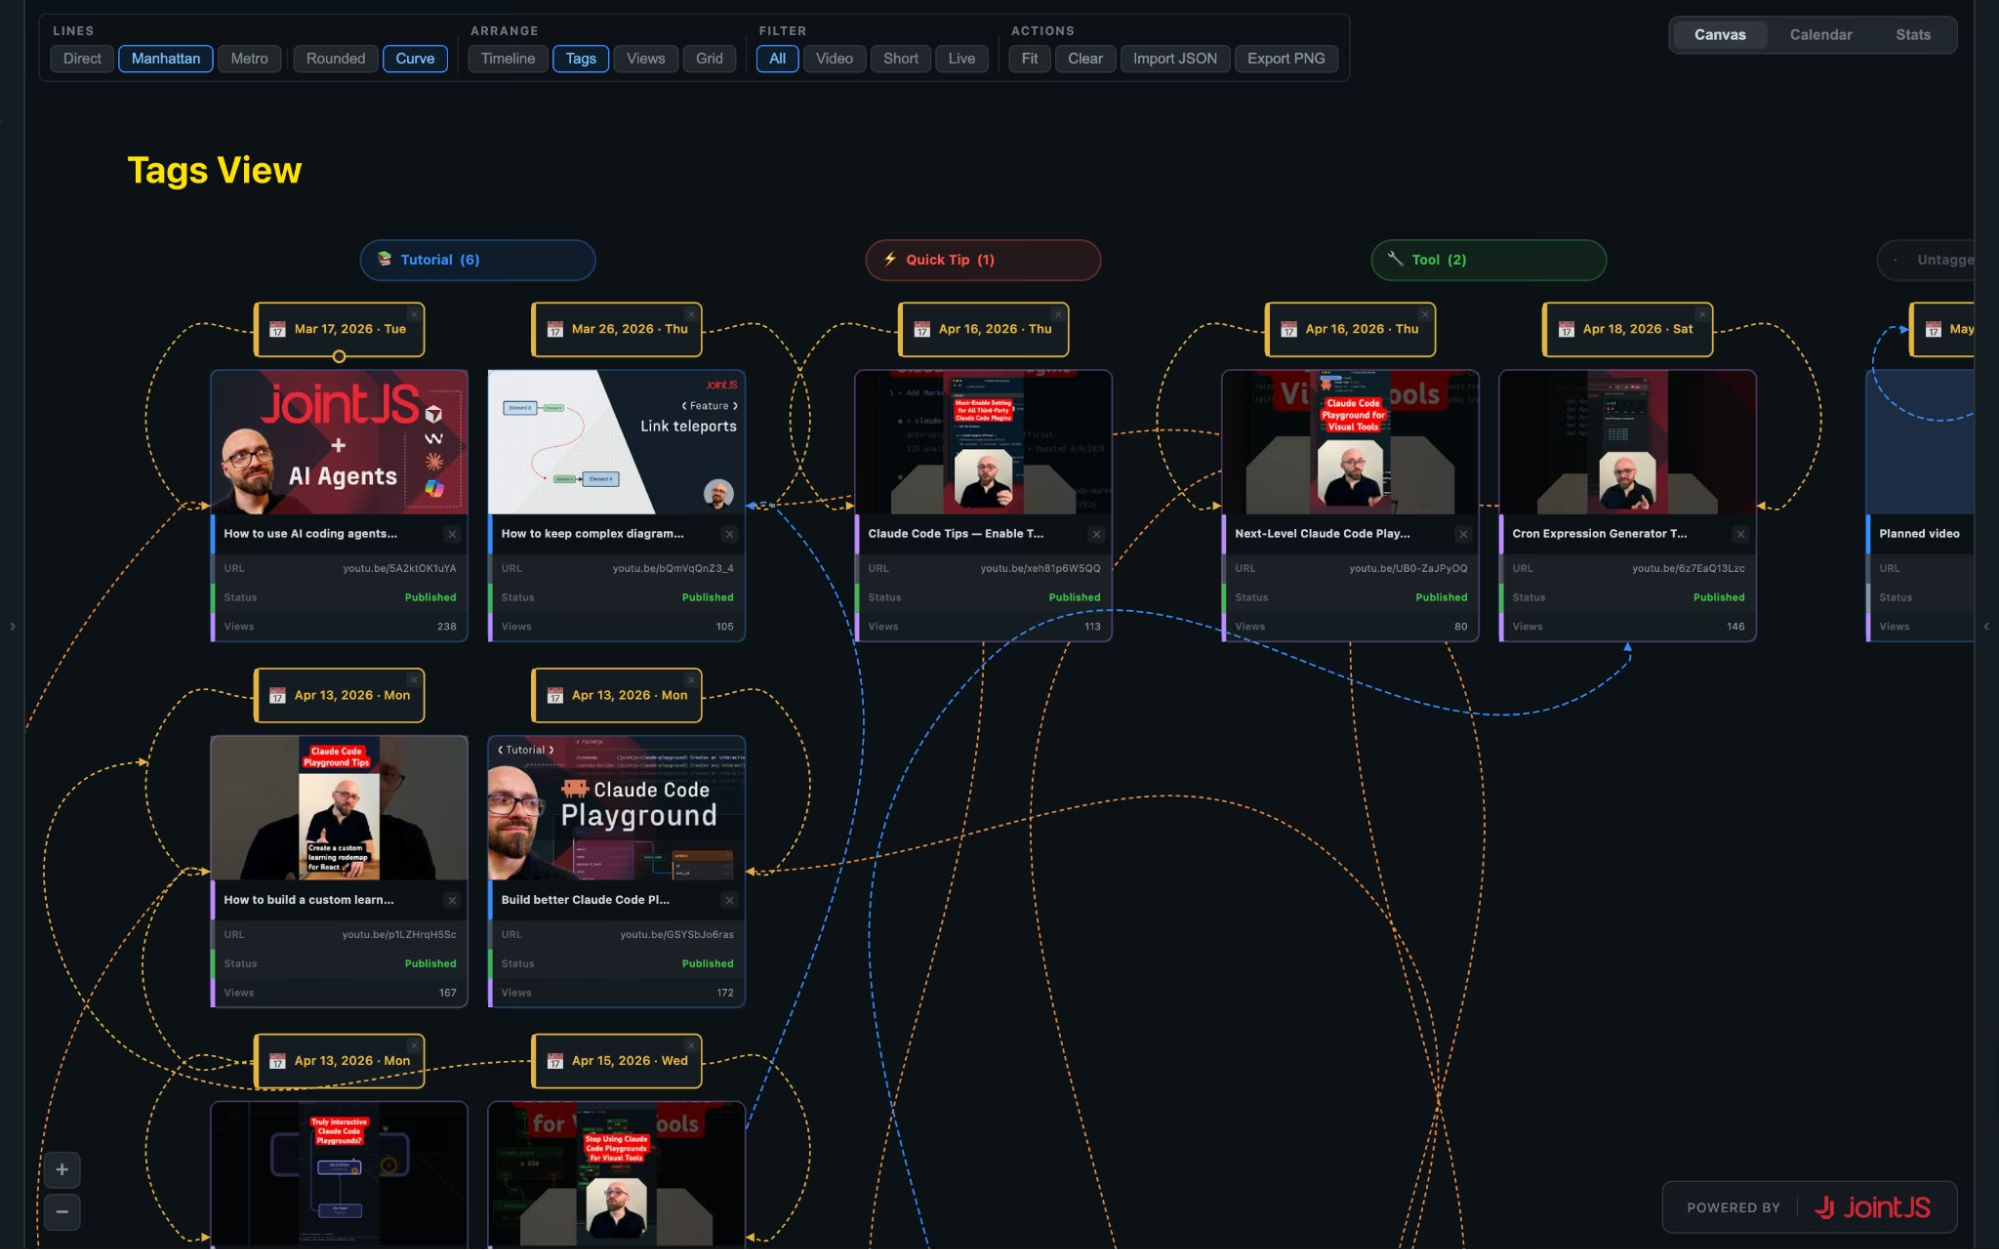
In the Tags view, videos are grouped into categories such as Tutorial, News, and Quick Tips, giving you a clear picture of the types of content a channel has published over time.
You can also create custom tags, link videos to them, and add icons or emojis to create a clearer visual language. That makes the tool adaptable to your own content structure.
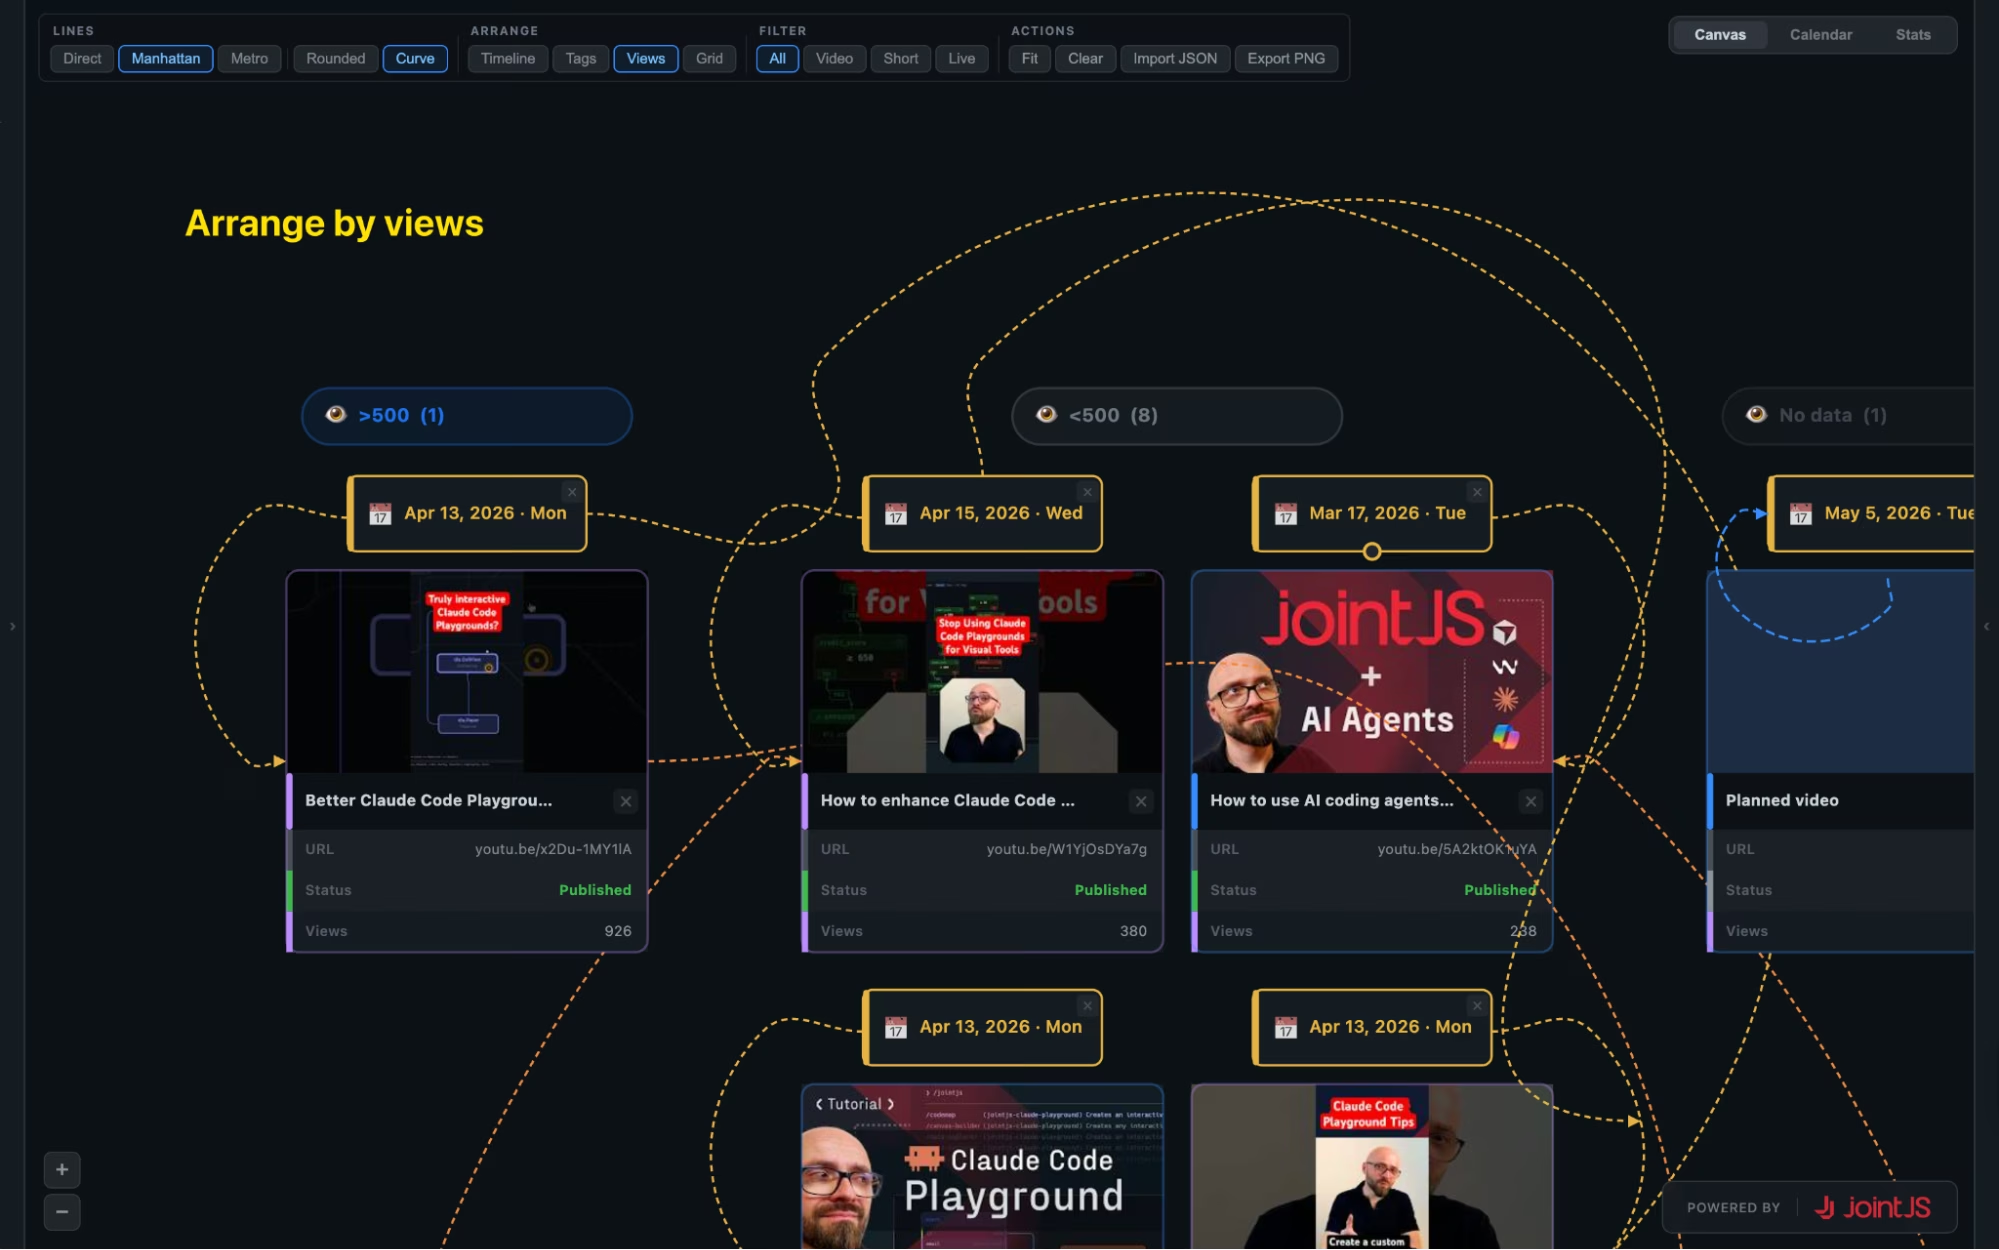
Arranging the content by Views will group videos by performance, making it easy to identify outliers.
If most videos fall into one range but a few perform significantly better, the pattern becomes clear immediately and can help you guide future content decisions.
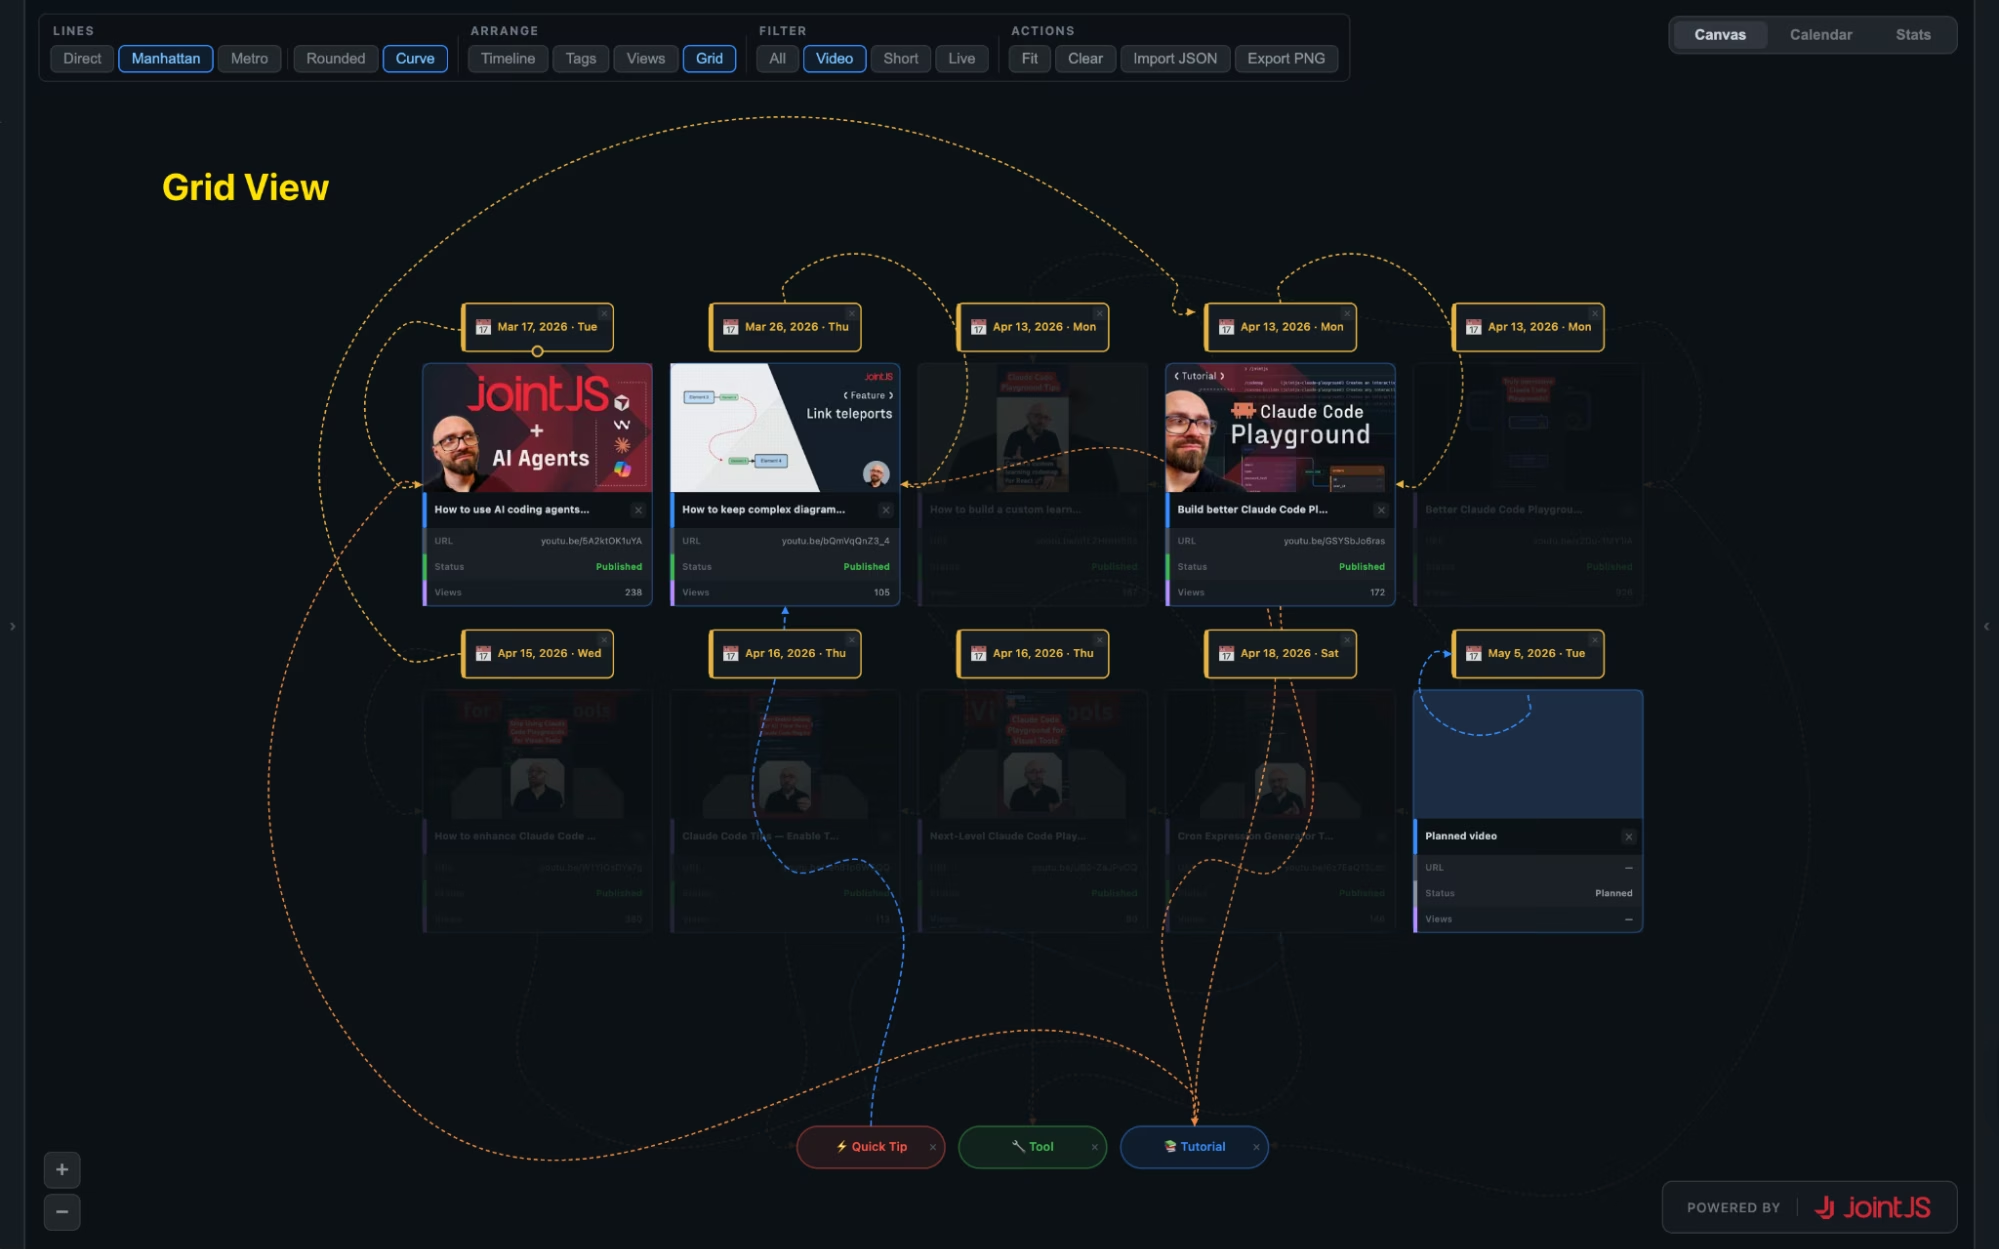
The Grid view gives you a compact overview of all videos, which is ideal if you want to filter them and better understand your content library and publishing strategy.
YouTube supports multiple types of content, including Long Videos, Shorts, and Live Streams, and the YouTube Channel Visualizer makes it easy to see which types of content you’re publishing.
By combining the filter with different arrangements, you can gain insight into which types of content perform well on your channel.
The diagram screen (Canvas) is the default, but the tool offers additional views that might be helpful.
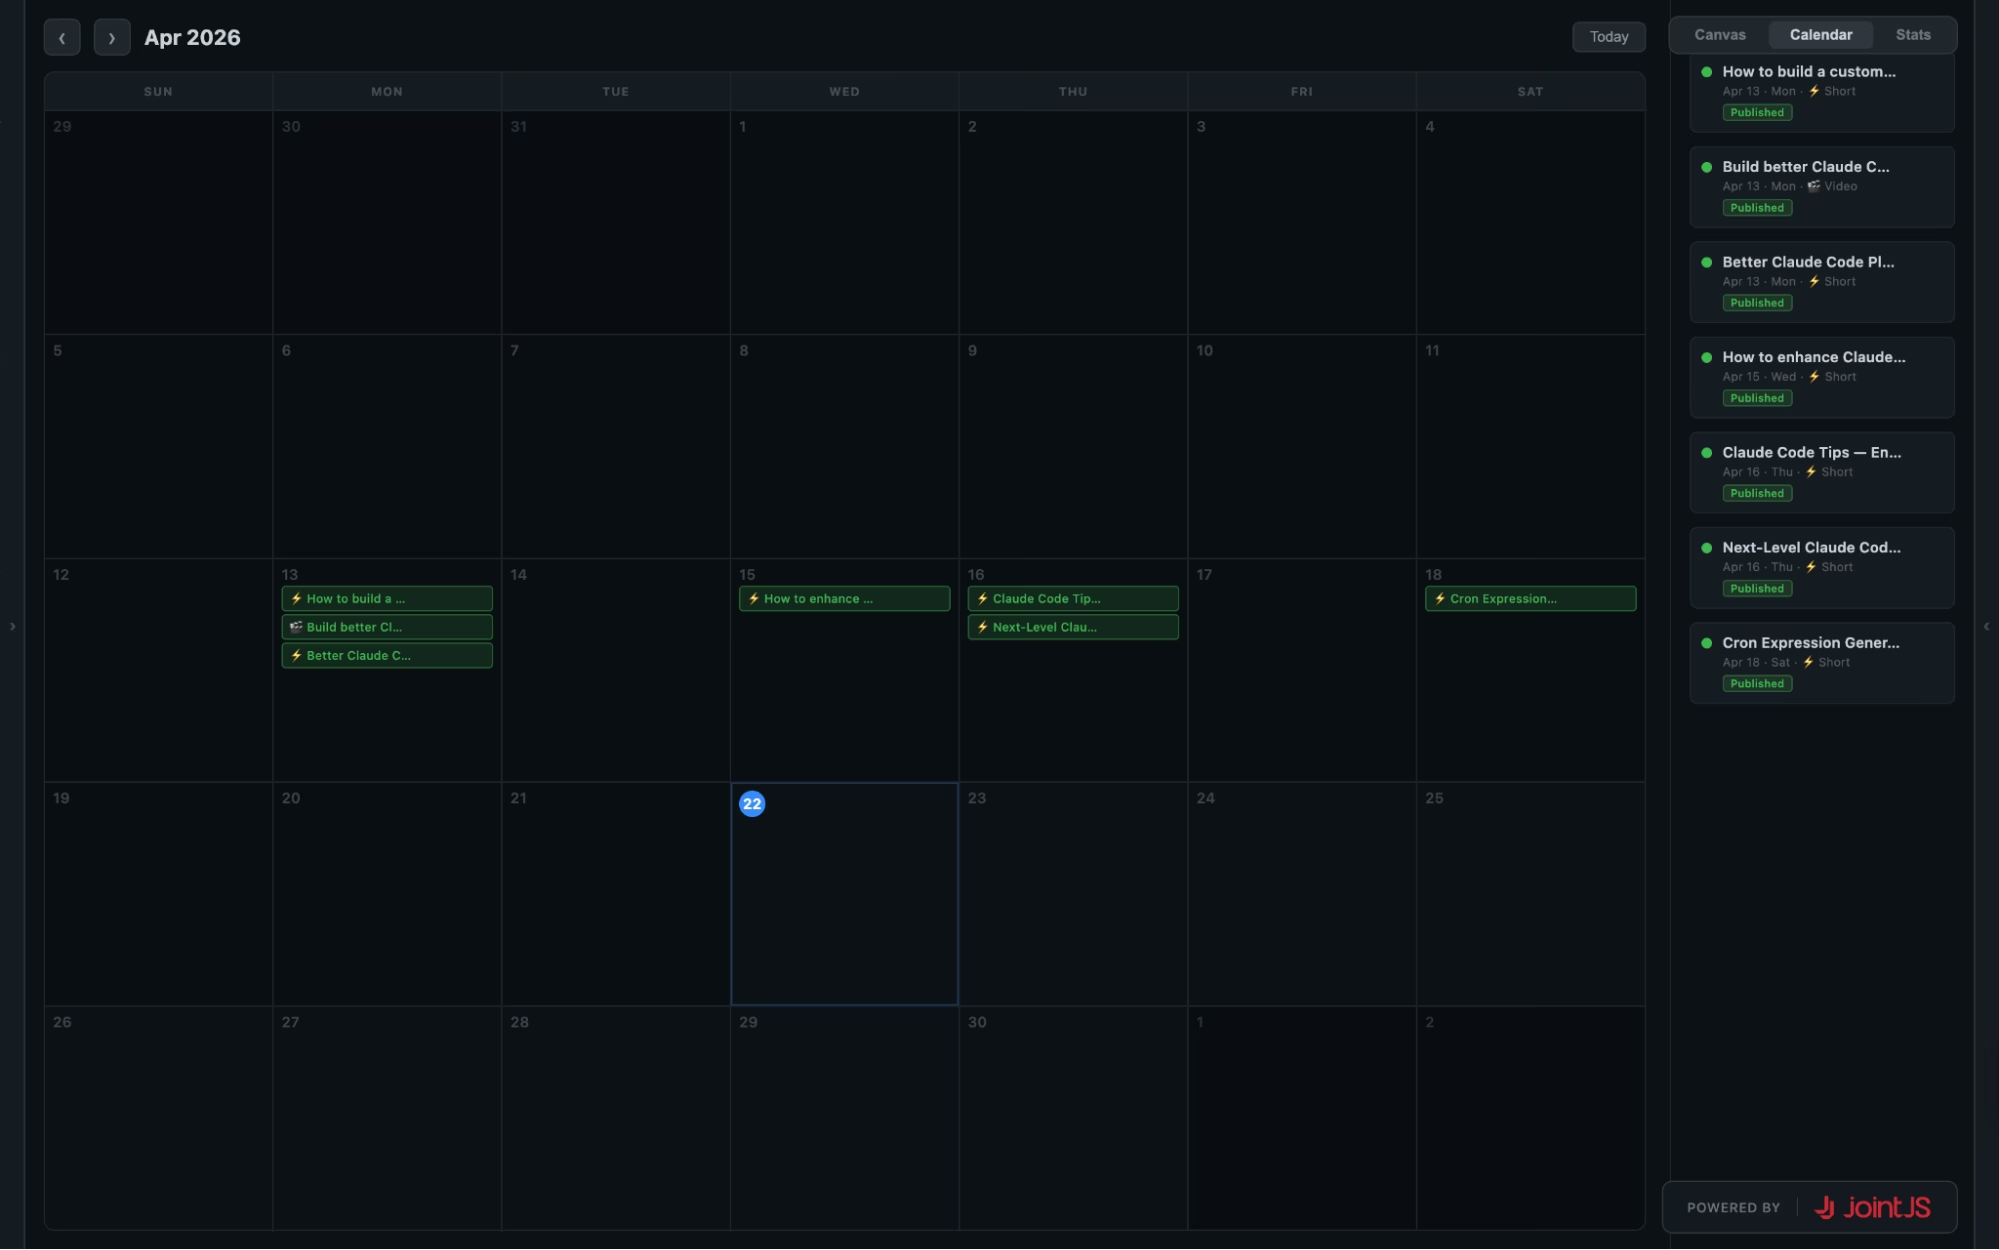
The Calendar screen highlights publishing activity over time.
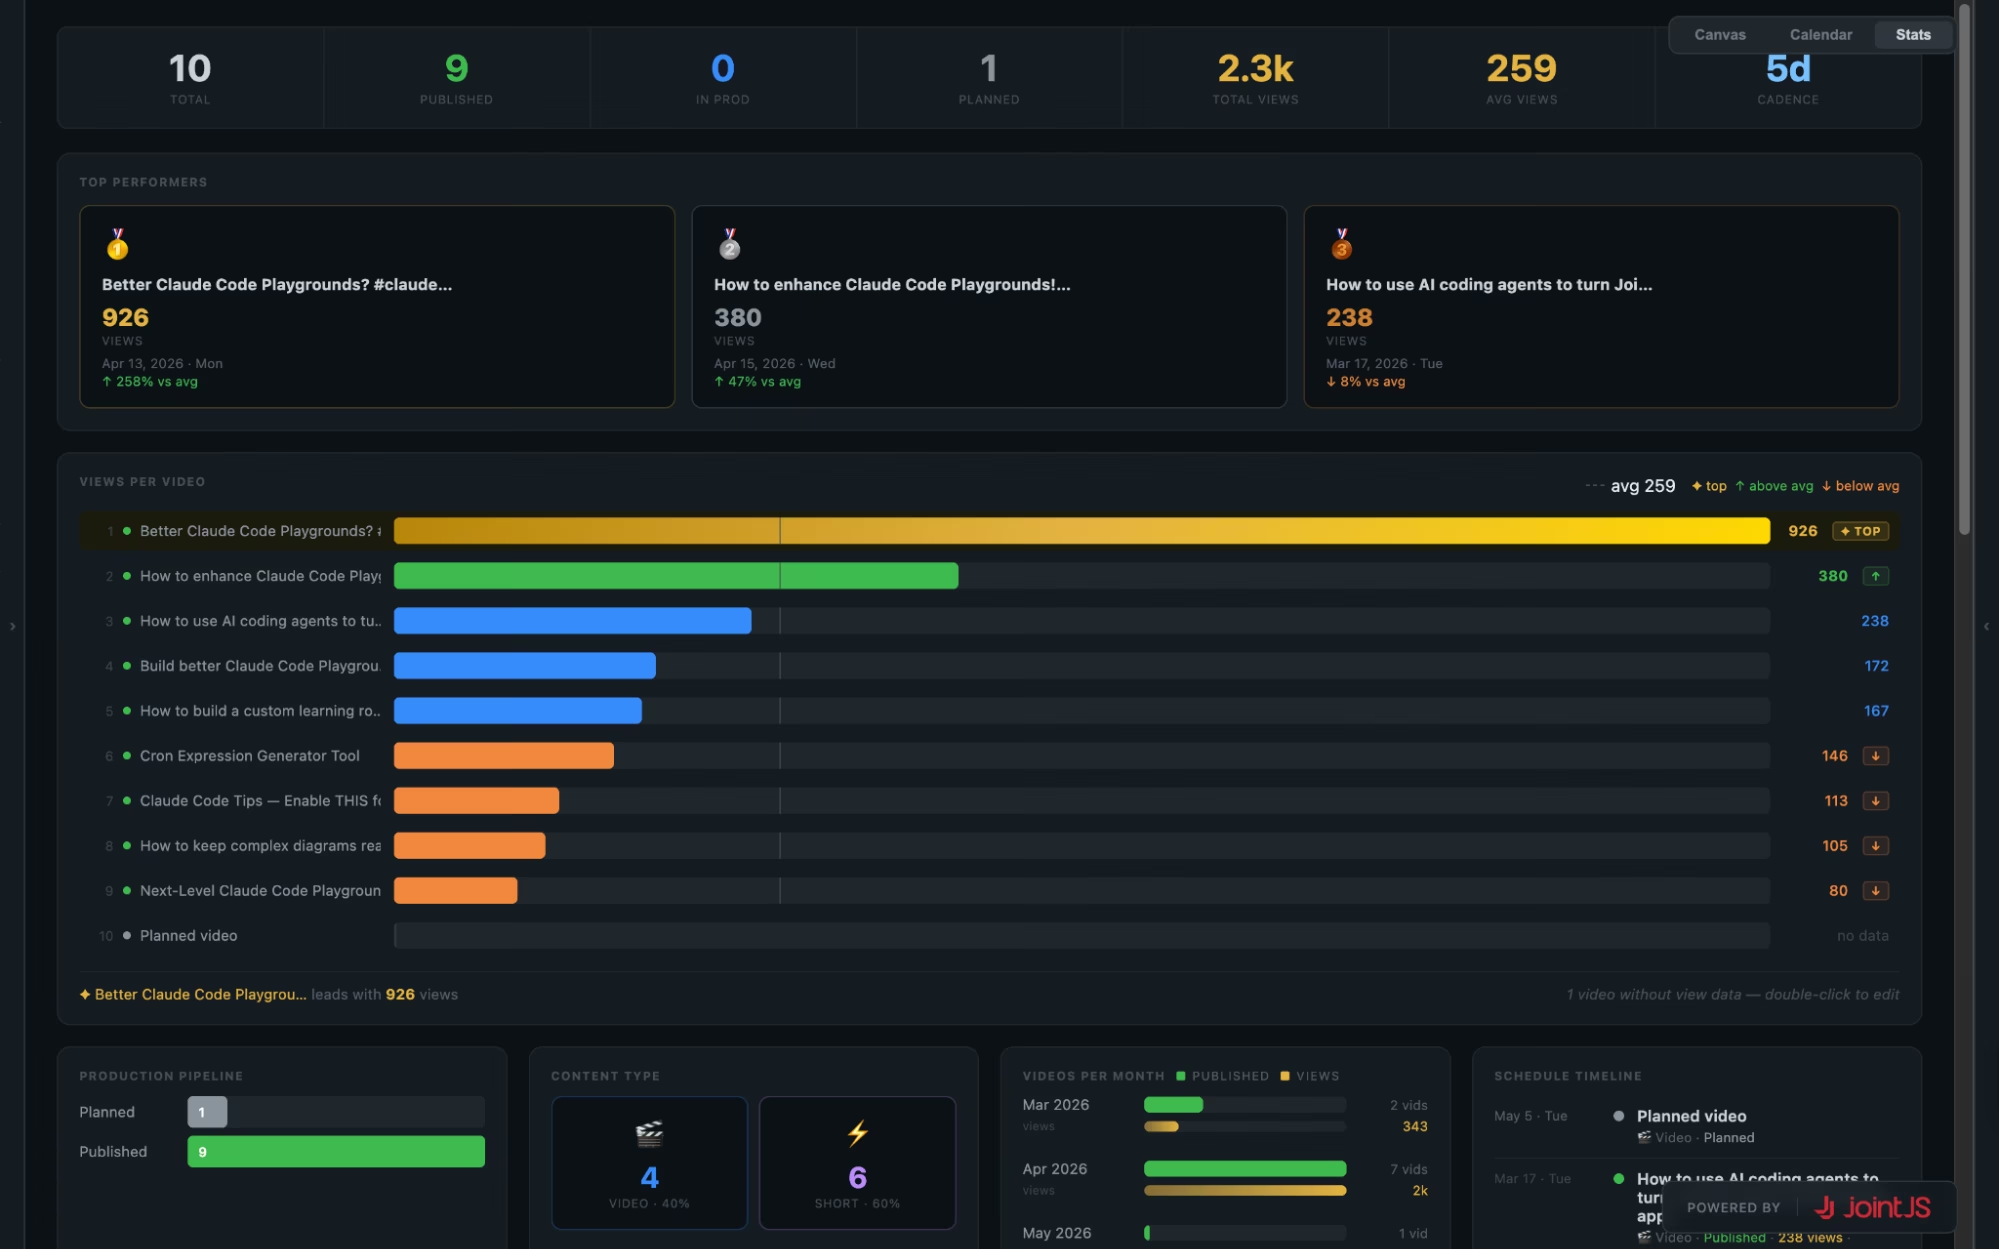
The Stats screen surfaces best-performing videos and other useful channel-level insights.
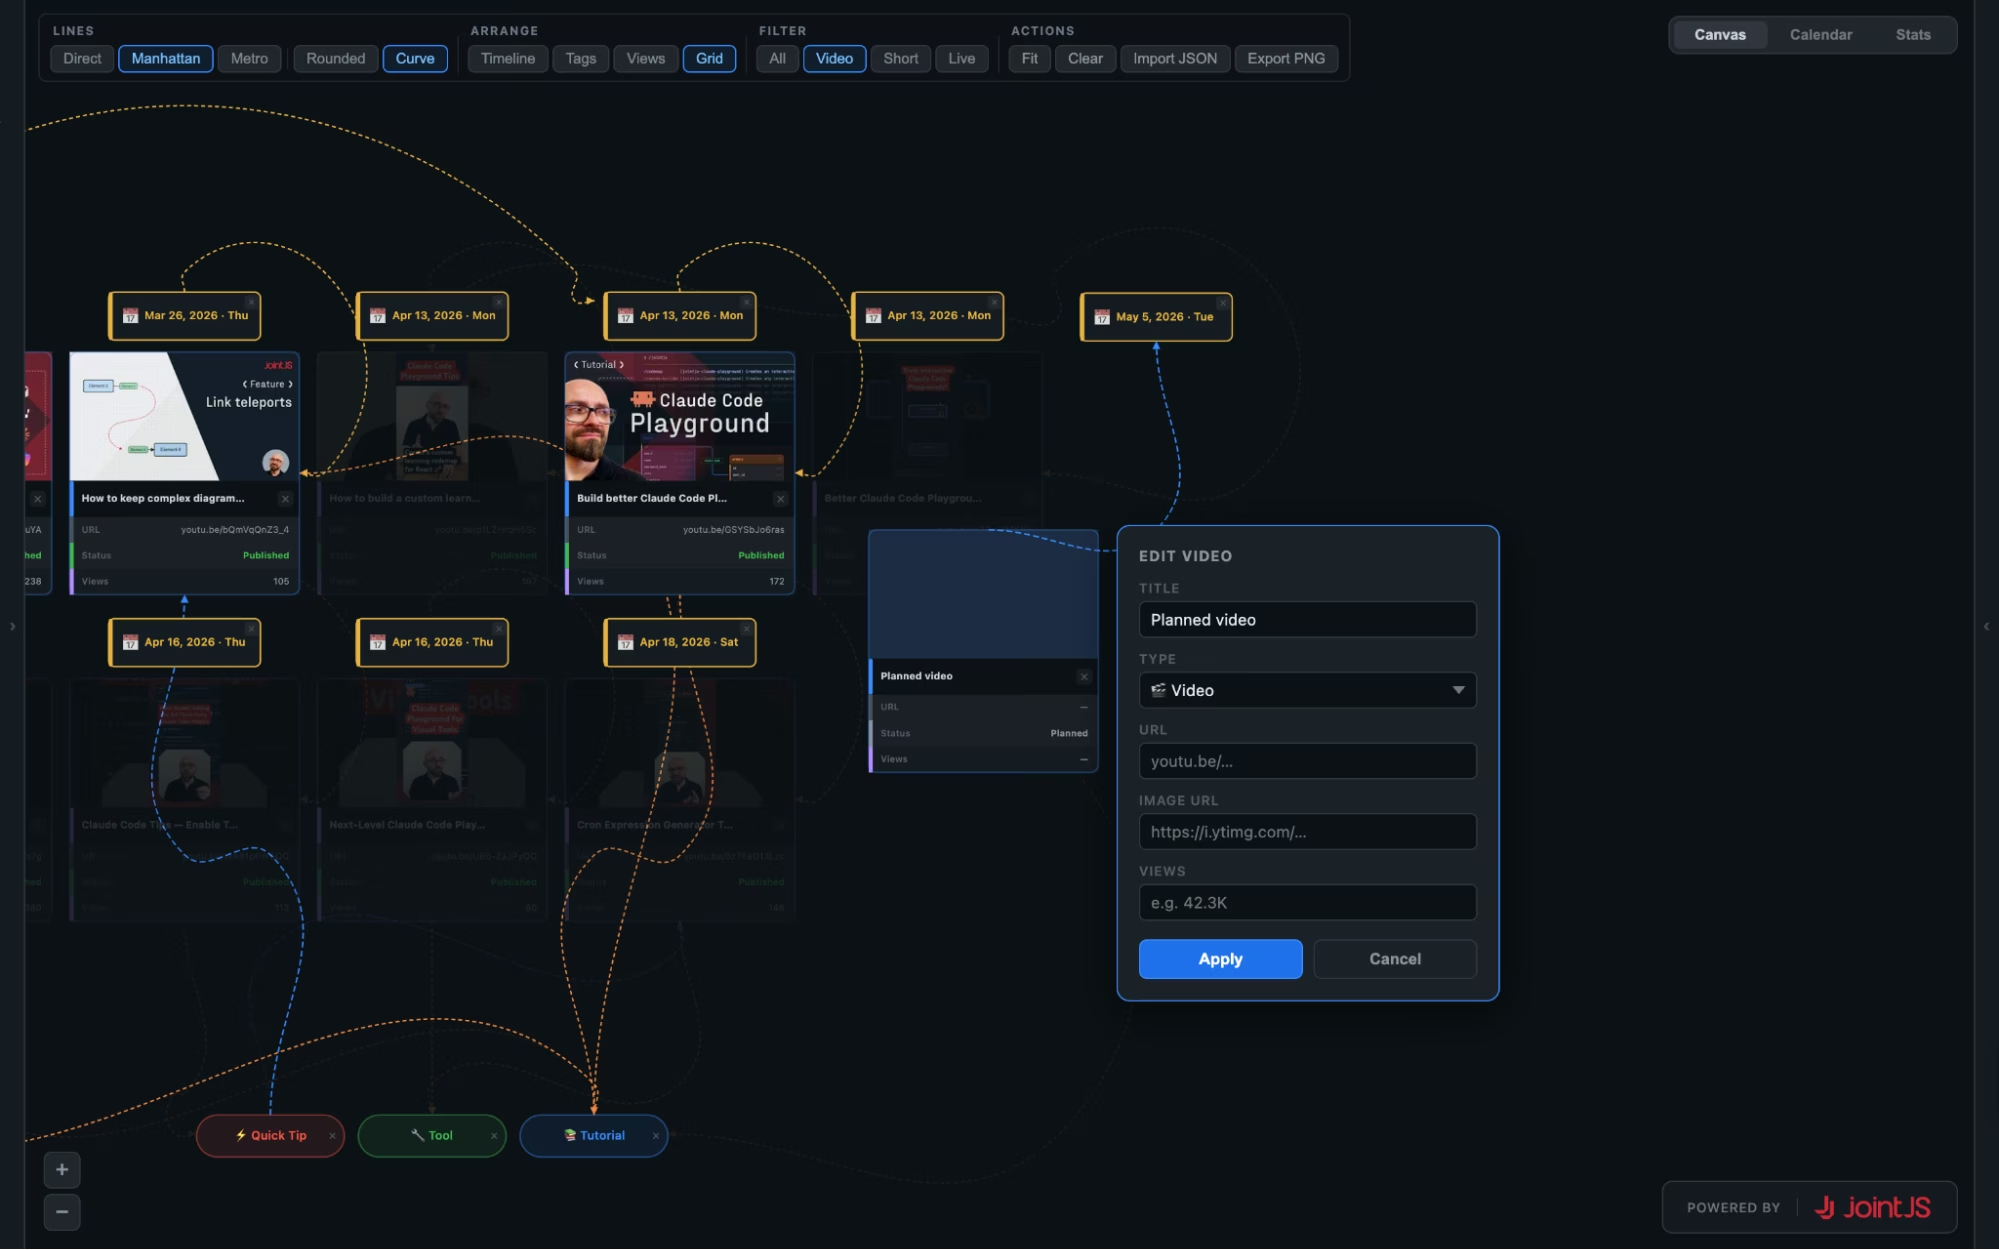
The app can also function as a lightweight planning tool. You can manually add a new video card, give it a title, define its type, set its status, and connect it to a date or tag.
So the same interface can help you understand past output and organize future work, making the diagram useful for content planning, editorial organization, and maintaining a high-level overview of your publishing pipeline.
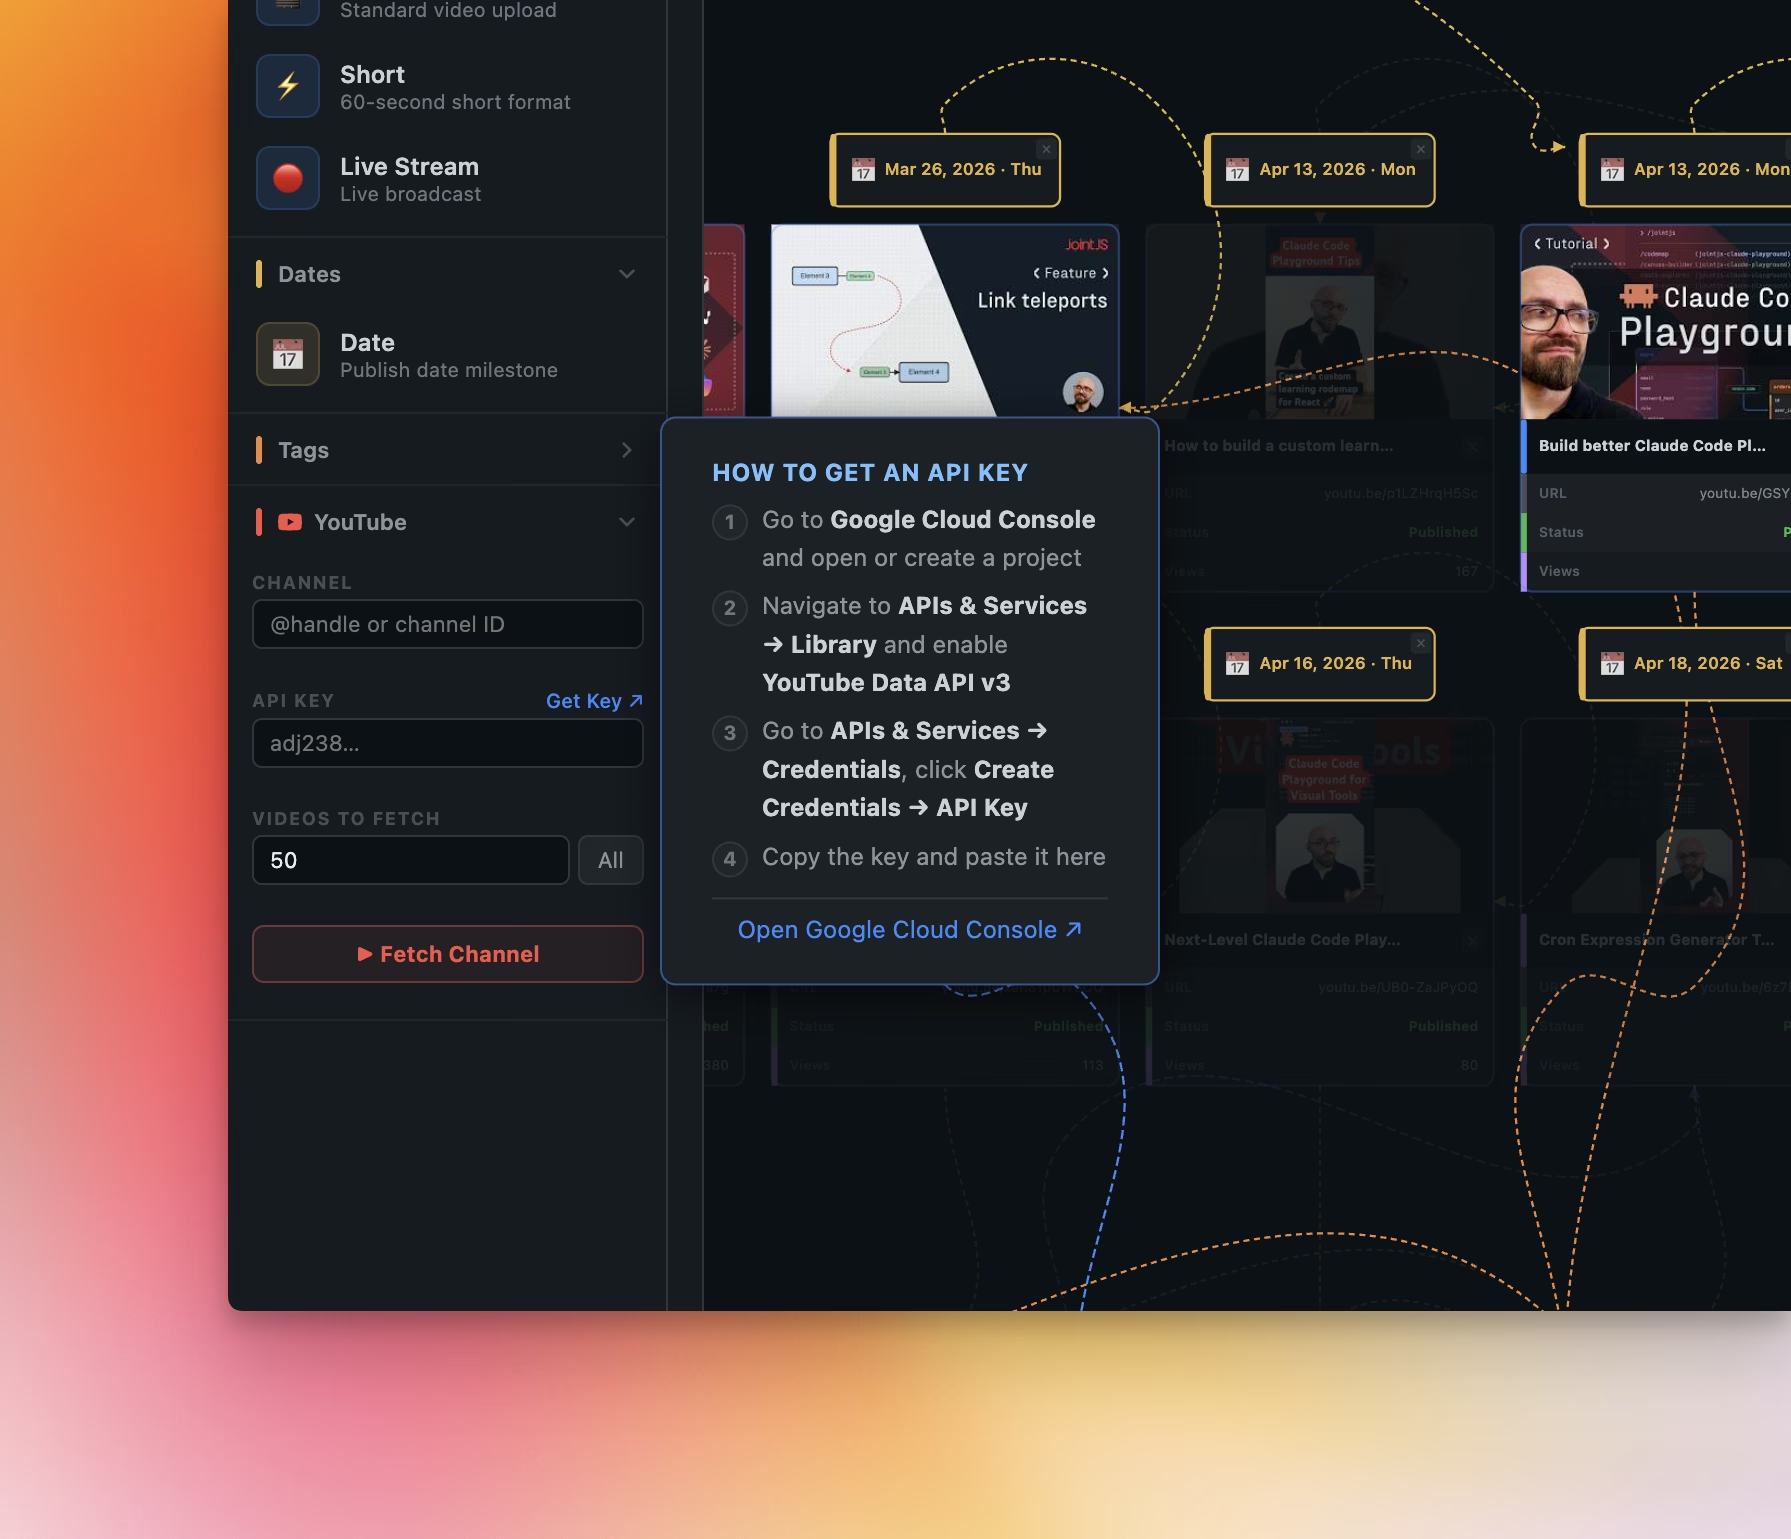
The app includes an API panel where you can import your own YouTube channel by providing:
Because the visualization is powered by JointJS, it remains smooth even with larger datasets. That makes it practical not just for small channels, but for larger video libraries as well.
Note that the tool isn’t optimized to load several hundreds of videos, so with massive datasets, you might experience longer load times.
The YouTube Channel Visualizer was vibe-coded as a self-contained, single-page app in a single HTML file using the JointJS Claude Playground plugin for Claude Code.
It took some refinement to get to its current state, but aside from some lightweight code tweaking and adjustments, it was vibe-coded end to end.
Everything is stored in localStorage, so your edits remain available after a refresh, without having to create an account.
If you want something more portable, you can export the current state from the right sidebar in several formats:
This keeps the app simple and practical:
The PNG export is especially useful if you want to share a visual representation of your channel on social media or include it in your promo materials for potential sponsors.
If you want to build a tool like this, the key requirement is not just rendering data, but supporting visual interactions.
A visual graph interface depends on:
That’s why JointJS is such a good fit. It provides the diagramming foundation needed to move from a rough prototype to a practical visual tool.
A custom Claude Code Playground plugin with JointJS built-in makes it possible to prototype different kinds of visual tools easily. If you want to build graphs, codemaps, content visualizers, planning interfaces, workflow editors, or any other visual application, starting with JointJS already integrated removes a lot of friction.
Simply describe what you want to build in natural language and let Claude Code generate the first version. Then iterate and refine the result as needed.
This approach will let you build useful visual tools much faster while still relying on a proper diagramming library underneath.
If you want to visualize your YouTube channel in a way that goes beyond a flat list of uploads, an interactive diagram can reveal patterns that are otherwise easy to miss.
YouTube Channel Visualizer will help you with channel analysis, content planning, and experimentation. And more broadly, it shows how AI-assisted prototyping becomes much more effective when paired with the right visual foundation.


.png)


.jpg)
