This tutorial walks through building an interactive genogram (family tree) using JointJS and the @joint/layout-directed-graph package (which uses the open-source dagre library under the hood). The focus is on the automatic layout strategy — how we turn flat family data into a clean, hierarchical diagram without manually positioning any nodes.
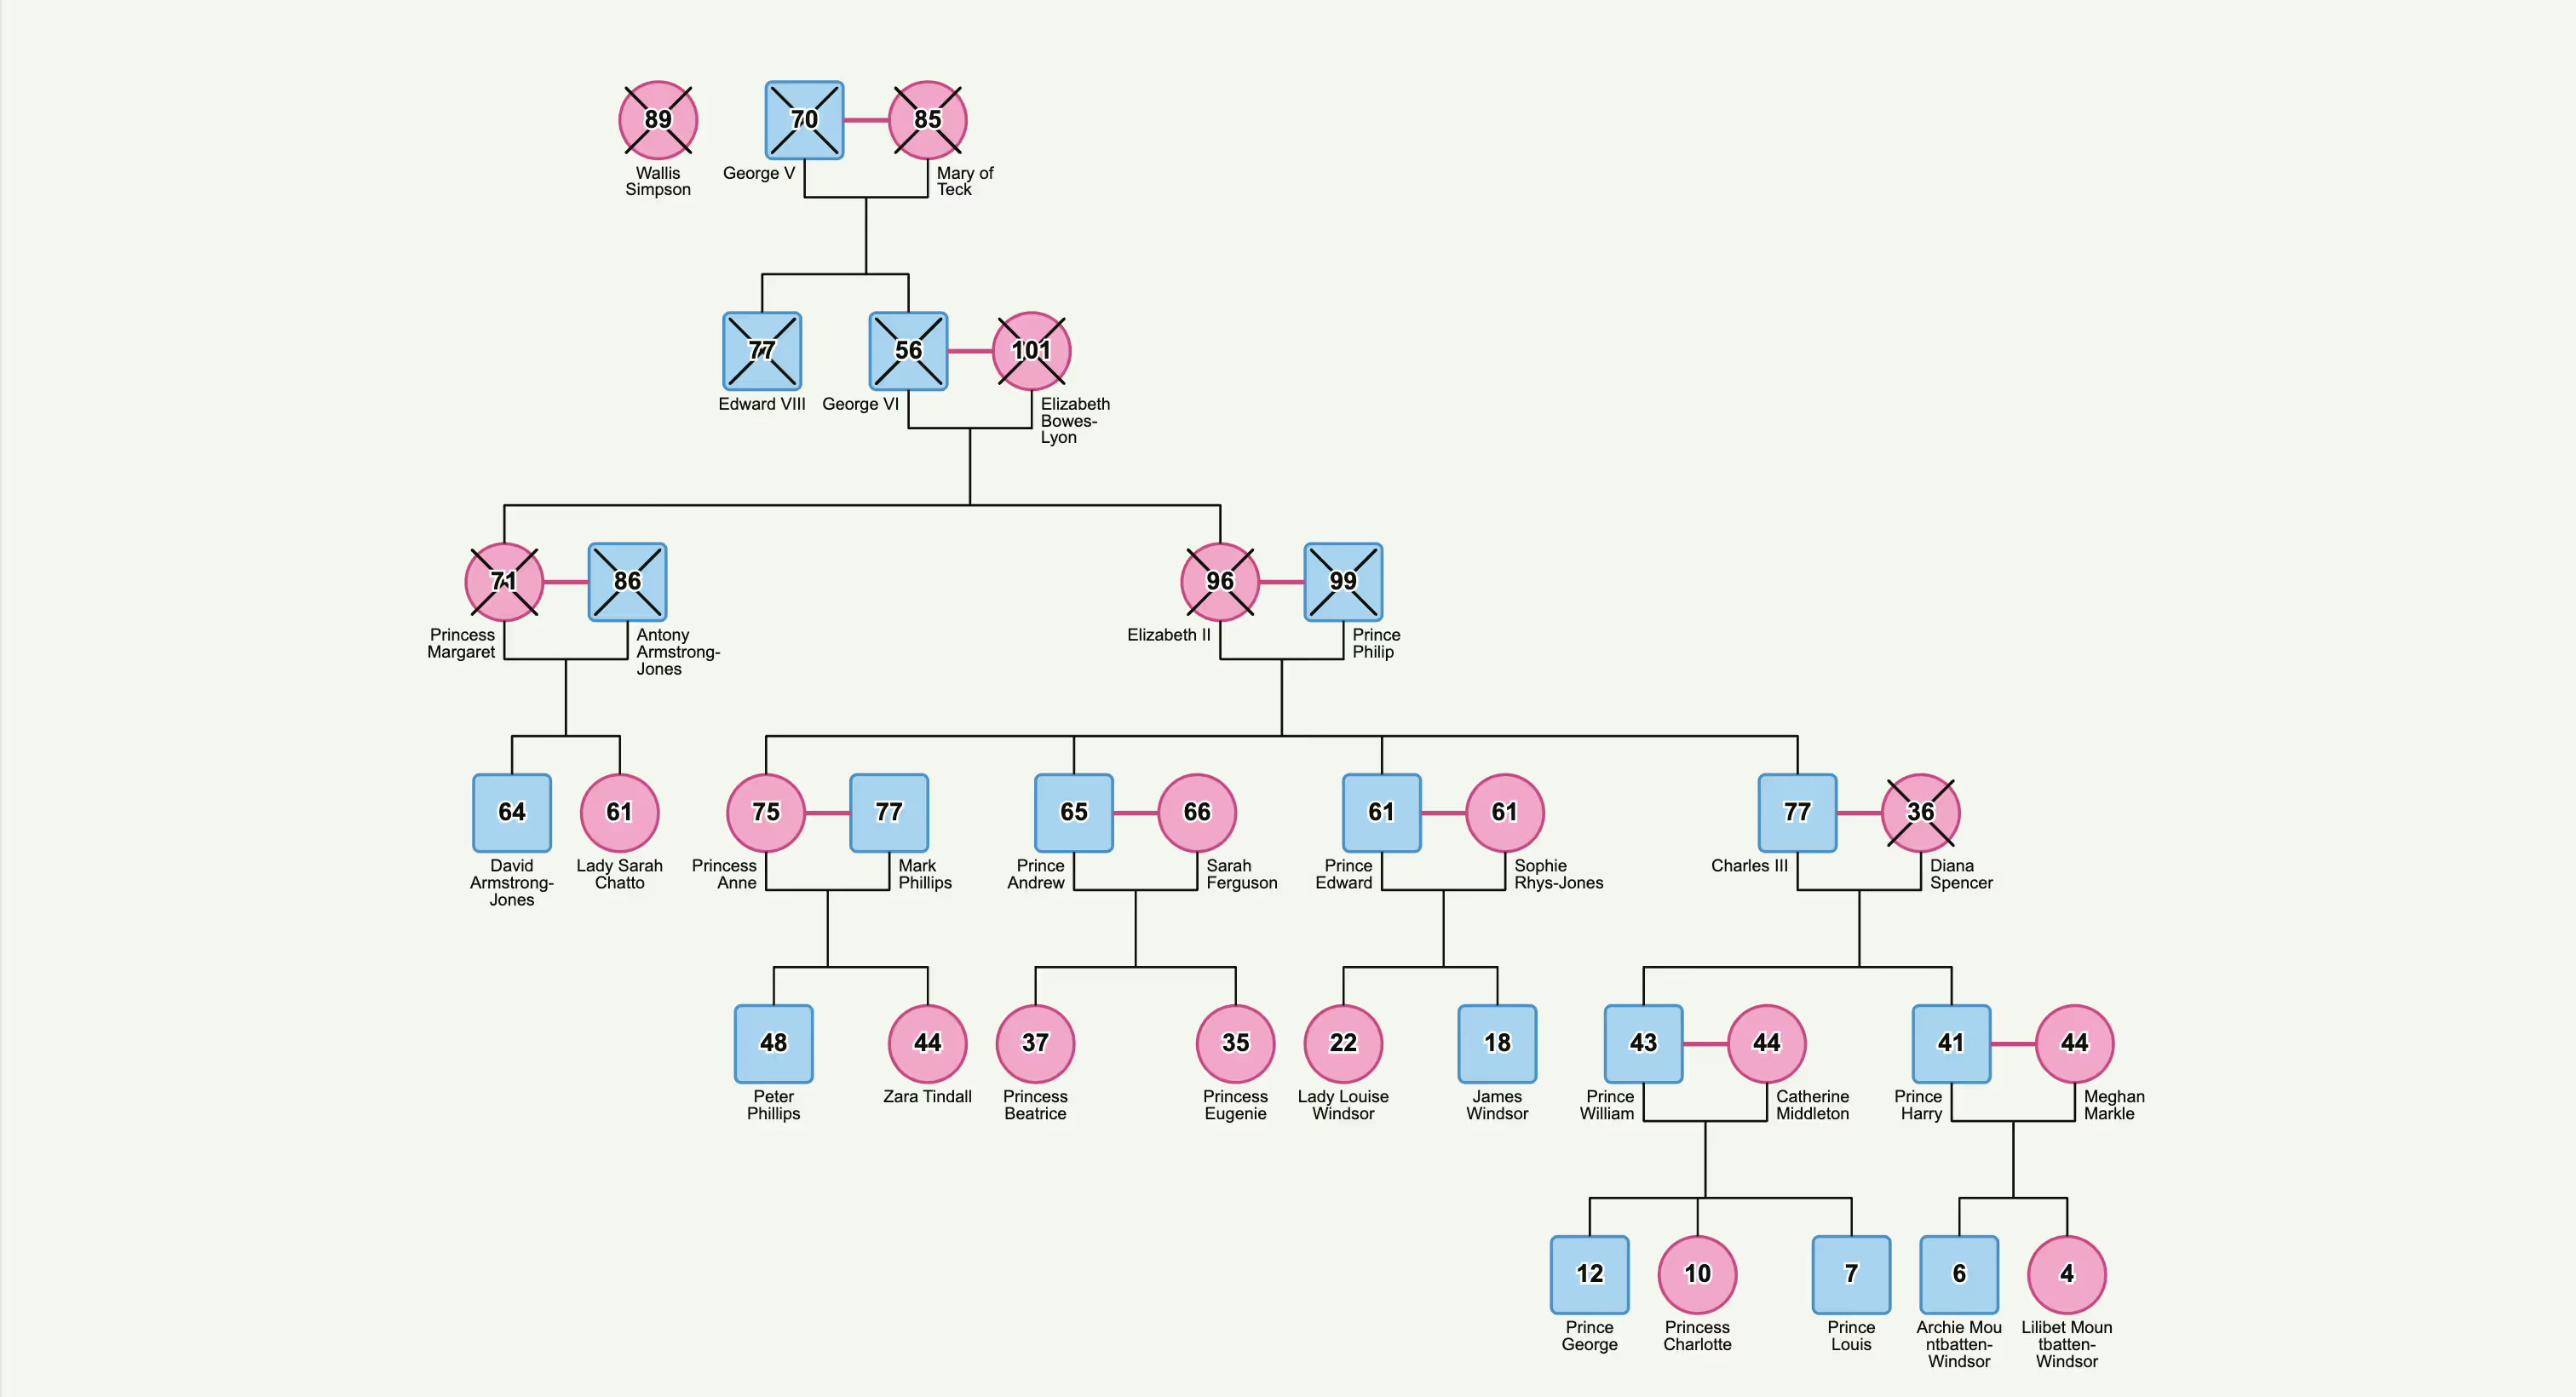
A genogram presents unique layout challenges compared to a standard directed graph:
The approach we take is:
-- CODE language-json --
src/
  main.ts                  Orchestration: paper setup, dataset loading, rendering
  shapes.ts                Custom element shapes (MalePerson, FemalePerson, UnknownPerson)
  highlighters.ts          Custom dia.HighlighterView classes (deceased cross, adopted brackets)
  layout/
    index.ts               Genogram layout algorithm (DirectedGraph + couple containers)
    minimize-crossings.ts  5-phase crossing minimization for DirectedGraph's customOrder
  utils.ts                 Element creation, lineage highlighting, family tree graph
  data.ts                  Data types and parsing (PersonNode, parent-child/mate links)
  theme.ts                 Centralized sizes, colors, z-index defaults, link style overrides
  styles.css               Paper container and hover highlight styles
  families/                Dataset JSON files (including benchmark.json ~1000 persons)
scripts/
  test-layout.cts          Node.js layout test (no browser needed)
The family data lives in JSON files under src/families/ as a flat array of person objects:
-- CODE language-json --
[
  { "id": 1, "name": "Father", "sex": "M" },
  { "id": 2, "name": "Mother", "sex": "F" },
  { "id": 3, "name": "Child", "sex": "M", "mother": 2, "father": 1, "dob": "1990-01-15" }
]
Parent-child relationships are derived from each person's mother and father fields. Mate (couple) relationships are derived from shared children — if two persons appear as mother and father of the same child, they are mates.
-- CODE language-js --
// data.ts
export function getParentChildLinks(persons: PersonNode[]): ParentChildLink[] {
    const links: ParentChildLink[] = [];
    for (const person of persons) {
        if (typeof person.mother === 'number')
            links.push({ parentId: person.mother, childId: person.id });
        if (typeof person.father === 'number')
            links.push({ parentId: person.father, childId: person.id });
    }
    return links;
}
The DirectedGraph layout positions individual nodes. But in a genogram, a couple must occupy the same rank and sit next to each other. If we lay out each person independently, partners can end up on different ranks or far apart.
The solution: replace each couple with a single invisible rectangle that's wide enough to hold both partners side-by-side.
-- CODE language-js --
const extraWidth = linkStyle === 'orthogonal' ? sizes.symbolWidth : 0;
const container = new shapes.standard.Rectangle({
    size: {
        width: sizes.symbolWidth * 2 + sizes.coupleGap + extraWidth,
        height: sizes.symbolHeight
    },
});
In orthogonal mode, the container is widened by an extra symbol width to accommodate outward-shifted name labels (see Link Styles).
We track the mapping from person elements to their couple containers:
-- CODE language-js --
personIdToContainer.set(fromId, container);
personIdToContainer.set(toId, container);

function layoutId(personElId: string): string {
    const container = personIdToContainer.get(personElId);
    return container ? container.id : personElId;
}
All parent-child links are redirected to point from/to the container during layout. Solo (uncoupled) persons participate directly.
When both parents are in the same couple container, a child produces two parent-child links that both map to the same container-to-child layout edge. The layout engine gets confused by duplicate edges, so we deduplicate:
-- CODE language-js --
const edgeKey = `${srcLayout}->${tgtLayout}`;
const isDuplicate = layoutEdgeSet.has(edgeKey);
layoutEdgeSet.add(edgeKey);

if (isDuplicate) {
    (link as any)._layoutDuplicate = true;
}
Only the first occurrence participates in layout. Duplicates are added back to the graph afterward.
With containers replacing couples, solo elements standing alone, and deduplicated links — we run DirectedGraph layout with a customOrder callback that controls the crossing-minimization strategy. The ordering logic is extracted into minimize-crossings.ts:
-- CODE language-js --
import { minimizeCrossings } from './minimize-crossings';

DirectedGraph.layout(graph, {
    rankDir: 'TB',
    nodeSep: sizes.symbolGap,
    rankSep: sizes.levelGap,
    customOrder: (glGraph, jointGraph, defaultOrder) => minimizeCrossings(
        glGraph, jointGraph, defaultOrder,
        { parentChildLinks, layoutId, personById, identicalGroupOf, nodeMultipleGroup }
    ),
});
rankDir: 'TB' — top-to-bottom hierarchy (generations flow downward)symbolGap — horizontal spacing between nodeslevelGap — vertical spacing between generationscustomOrder — callback that replaces the built-in ordering with our multi-phase approachWe start with the layout engine's own node ordering as a baseline and measure crossings:
-- CODE language-js --
defaultOrder(glGraph);
let bestCrossings = totalCrossings();
let bestOrder = saveOrder();
What is a barycenter? In graph layout, the barycenter (center of mass) of a node is the average position of all its neighbors on an adjacent rank. For example, if a child has three parents at positions 1, 3, and 5, its barycenter is (1+3+5)/3 = 3. By sorting nodes on each rank by their barycenter values, connected nodes are pulled closer together, which tends to reduce edge crossings. This is one of the most widely used heuristics for layered graph drawing, originally described by Sugiyama, Tagawa, and Toda (1981).
Each node is reordered by the average position of its neighbors on the adjacent rank. We alternate between top-to-bottom (looking at parents) and bottom-to-top (looking at children) sweeps, keeping the best result:
-- CODE language-js --
for (let iter = 0; iter < 24; iter++) {
ranks.forEach(rank => reorderByBarycenter(rank, 'up'));
ranks.toReversed().forEach(rank => reorderByBarycenter(rank, 'down'));
const crossings = totalCrossings();
if (crossings < bestCrossings) {
bestCrossings = crossings;
bestOrder = saveOrder();
}
if (crossings === 0) break;
}
Within each barycenter sort, ties are broken by birth date and identical-twin group ID, ensuring siblings appear in a natural order.
For each node, we try every position in its rank and pick the one that minimizes total crossings across the entire graph. This escapes local minima that barycenter sweeps can't resolve. Ranks with more than 50 nodes are skipped to avoid O(n² × positions) performance issues on large datasets:
-- CODE language-js --
for (let i = 0; i < nodes.length; i++) {
    nodes.splice(i, 1);          // remove node
    for (let j = 0; j <= nodes.length; j++) {
        nodes.splice(j, 0, nodeId);  // try every position
        applyOrder(nodes);
        const cost = totalCrossings();
        // track best position...
        nodes.splice(j, 1);
    }
    nodes.splice(bestPos, 0, nodeId);  // insert at best
}
The layout engine treats couple containers as single nodes, so countCrossings() may return 0 even when visual crossings exist after containers are expanded into two partners. We fix this with computeContainerCrossings() — a crossing check using only real edges (container-to-container) — followed by barycenter sweeps that use real-edge adjacency for containers and layout-graph neighbors for dummy nodes (preserving link routing quality).
The key insight: we must check container crossings after each sweep direction separately (top-to-bottom and bottom-to-top), saving the best result, because a bottom-to-top sweep can reverse the fix from a top-to-bottom sweep.
Crossing minimization may separate siblings from the same multiple-birth group. We pull group members together at the position of the leftmost member, with identical twins kept adjacent:
-- CODE language-js --
members.sort((a, b) => {
    // Identical group first, then birth date
});
filtered.splice(insertAt, 0, ...members);
After layout, each container has a position. We split it into two person elements, deciding who goes left based on their parents' X positions (so links don't cross unnecessarily):
-- CODE language-js --
const fromParentX = getParentX(fromId);
const toParentX = getParentX(toId);

const [leftEl, rightEl] = fromParentX <= toParentX
    ? [fromEl, toEl] : [toEl, fromEl];

const inset = linkStyle === 'orthogonal' ? sizes.symbolWidth / 2 : 0;
leftEl.position(pos.x + inset, pos.y);
rightEl.position(pos.x + inset + sizes.symbolWidth + gap, pos.y);
In orthogonal mode, persons are inset from the container edge to center them under the wider container. Name labels are also shifted outward so they don't overlap:
-- CODE language-js --
if (linkStyle === 'orthogonal') {
    leftEl.attr('name', { textAnchor: 'end', x: `calc(w / 2 - ${sizes.nameMargin})` });
    rightEl.attr('name', { textAnchor: 'start', x: `calc(w / 2 + ${sizes.nameMargin})` });
}
Parent-child links must visually originate from the midpoint between both parents, not from one parent alone. After layout, we reconnect each link to the real person element and add vertices. The routing depends on the link style:
Fan style (default) — horizontal to couple midpoint, vertical down, horizontal to child:
-- CODE language-js --
const midX = (sourceCenter.x + partnerCenter.x) / 2;
const midY = (sourceCenter.y + partnerCenter.y) / 2;
const halfwayY = (midY + targetCenter.y) / 2;

link.vertices([
    { x: midX, y: midY },              // couple midpoint
    { x: midX, y: halfwayY },          // drop down vertically
    { x: targetCenter.x, y: halfwayY } // turn toward child
]);
Orthogonal style — vertical down from parent, horizontal to couple midpoint, vertical down again, horizontal to child:
-- CODE language-js --
const thirdY = midY + (targetCenter.y - midY) / 3;
const twoThirdsY = midY + 2 * (targetCenter.y - midY) / 3;

link.vertices([
    { x: sourceCenter.x, y: thirdY },   // drop down from parent
    { x: midX, y: thirdY },             // horizontal to midpoint
    { x: midX, y: twoThirdsY },         // drop down again
    { x: targetCenter.x, y: twoThirdsY } // horizontal to child
]);
Twins and triplets share a common fork point. Instead of each child's link turning independently, they converge at the average X position of the group:
-- CODE language-js --
const avgX = uniqueIds.reduce((sum, id) => {
    return sum + (graph.getCell(id) as dia.Element).getCenter().x;
}, 0) / uniqueIds.length;
// Fan style uses forkX instead of targetCenter.x:
link.vertices([
    { x: midX, y: midY },
    { x: midX, y: halfwayY },
    { x: forkX, y: halfwayY }   // shared fork point
]);
Identical twins are marked with a horizontal dashed line connecting their parent-child links. This uses JointJS link-to-link connections with connectionRatio anchors:
-- CODE language-js --
const ratioA = computeAnchorRatio(linkA, ANCHOR_VERTICAL_OFFSET);
const ratioB = computeAnchorRatio(linkB, ANCHOR_VERTICAL_OFFSET);

new IdenticalLinkShape({
    source: { id: linkA.id, anchor: { name: 'connectionRatio', args: { ratio: ratioA } } },
    target: { id: linkB.id, anchor: { name: 'connectionRatio', args: { ratio: ratioB } } },
});
The computeAnchorRatio function walks backwards along the link path to find the point at a specific vertical offset from the child, converting that into a 0-1 ratio along the total path length.
Mate links are horizontal connections between partners. They're added after layout because they're bidirectional and would break the layout engine's DAG assumption:
-- CODE language-js --
const mateJointLinks = mateLinks.map((ml) => {
    return new MateLinkShape({
        source: { id: String(ml.from), anchor: { name: 'center', args: { useModelGeometry: true } } },
        target: { id: String(ml.to), anchor: { name: 'center', args: { useModelGeometry: true } } },
    });
});
graph.addCells(mateJointLinks);
Genogram symbols like the deceased cross and adopted brackets are implemented as custom dia.HighlighterView subclasses, decoupled from the shape definitions. Each highlighter uses tagName = 'path' and sets static attributes in preinitialize(), with only the dynamic d attribute computed in highlight():
-- CODE language-js --
class DeceasedHighlighter extends dia.HighlighterView {
    preinitialize() {
        this.tagName = 'path';
        this.attributes = {
            stroke: colors.dark,
            strokeWidth: 2,
            strokeLinecap: 'round',
            fill: 'none',
        };
    }

    protected highlight(elementView: dia.ElementView<dia.Element>) {
        const { width, height } = elementView.model.size();
        const p = crossPadding;
        const d = `M ${p} ${p} ${width - p} ${height - p} M ${width - p} ${p} ${p} ${height - p}`;
        this.el.setAttribute('d', d);
    }
}
Highlighters are applied after the graph is rendered. The deceased cross uses z: 2 to render under the age label, while the adopted brackets need no special z ordering:
-- CODE language-js --
DeceasedHighlighter.add(cellView, 'body', 'deceased-cross', { z: 2 });
AdoptedHighlighter.add(cellView, 'body', 'adopted-brackets');
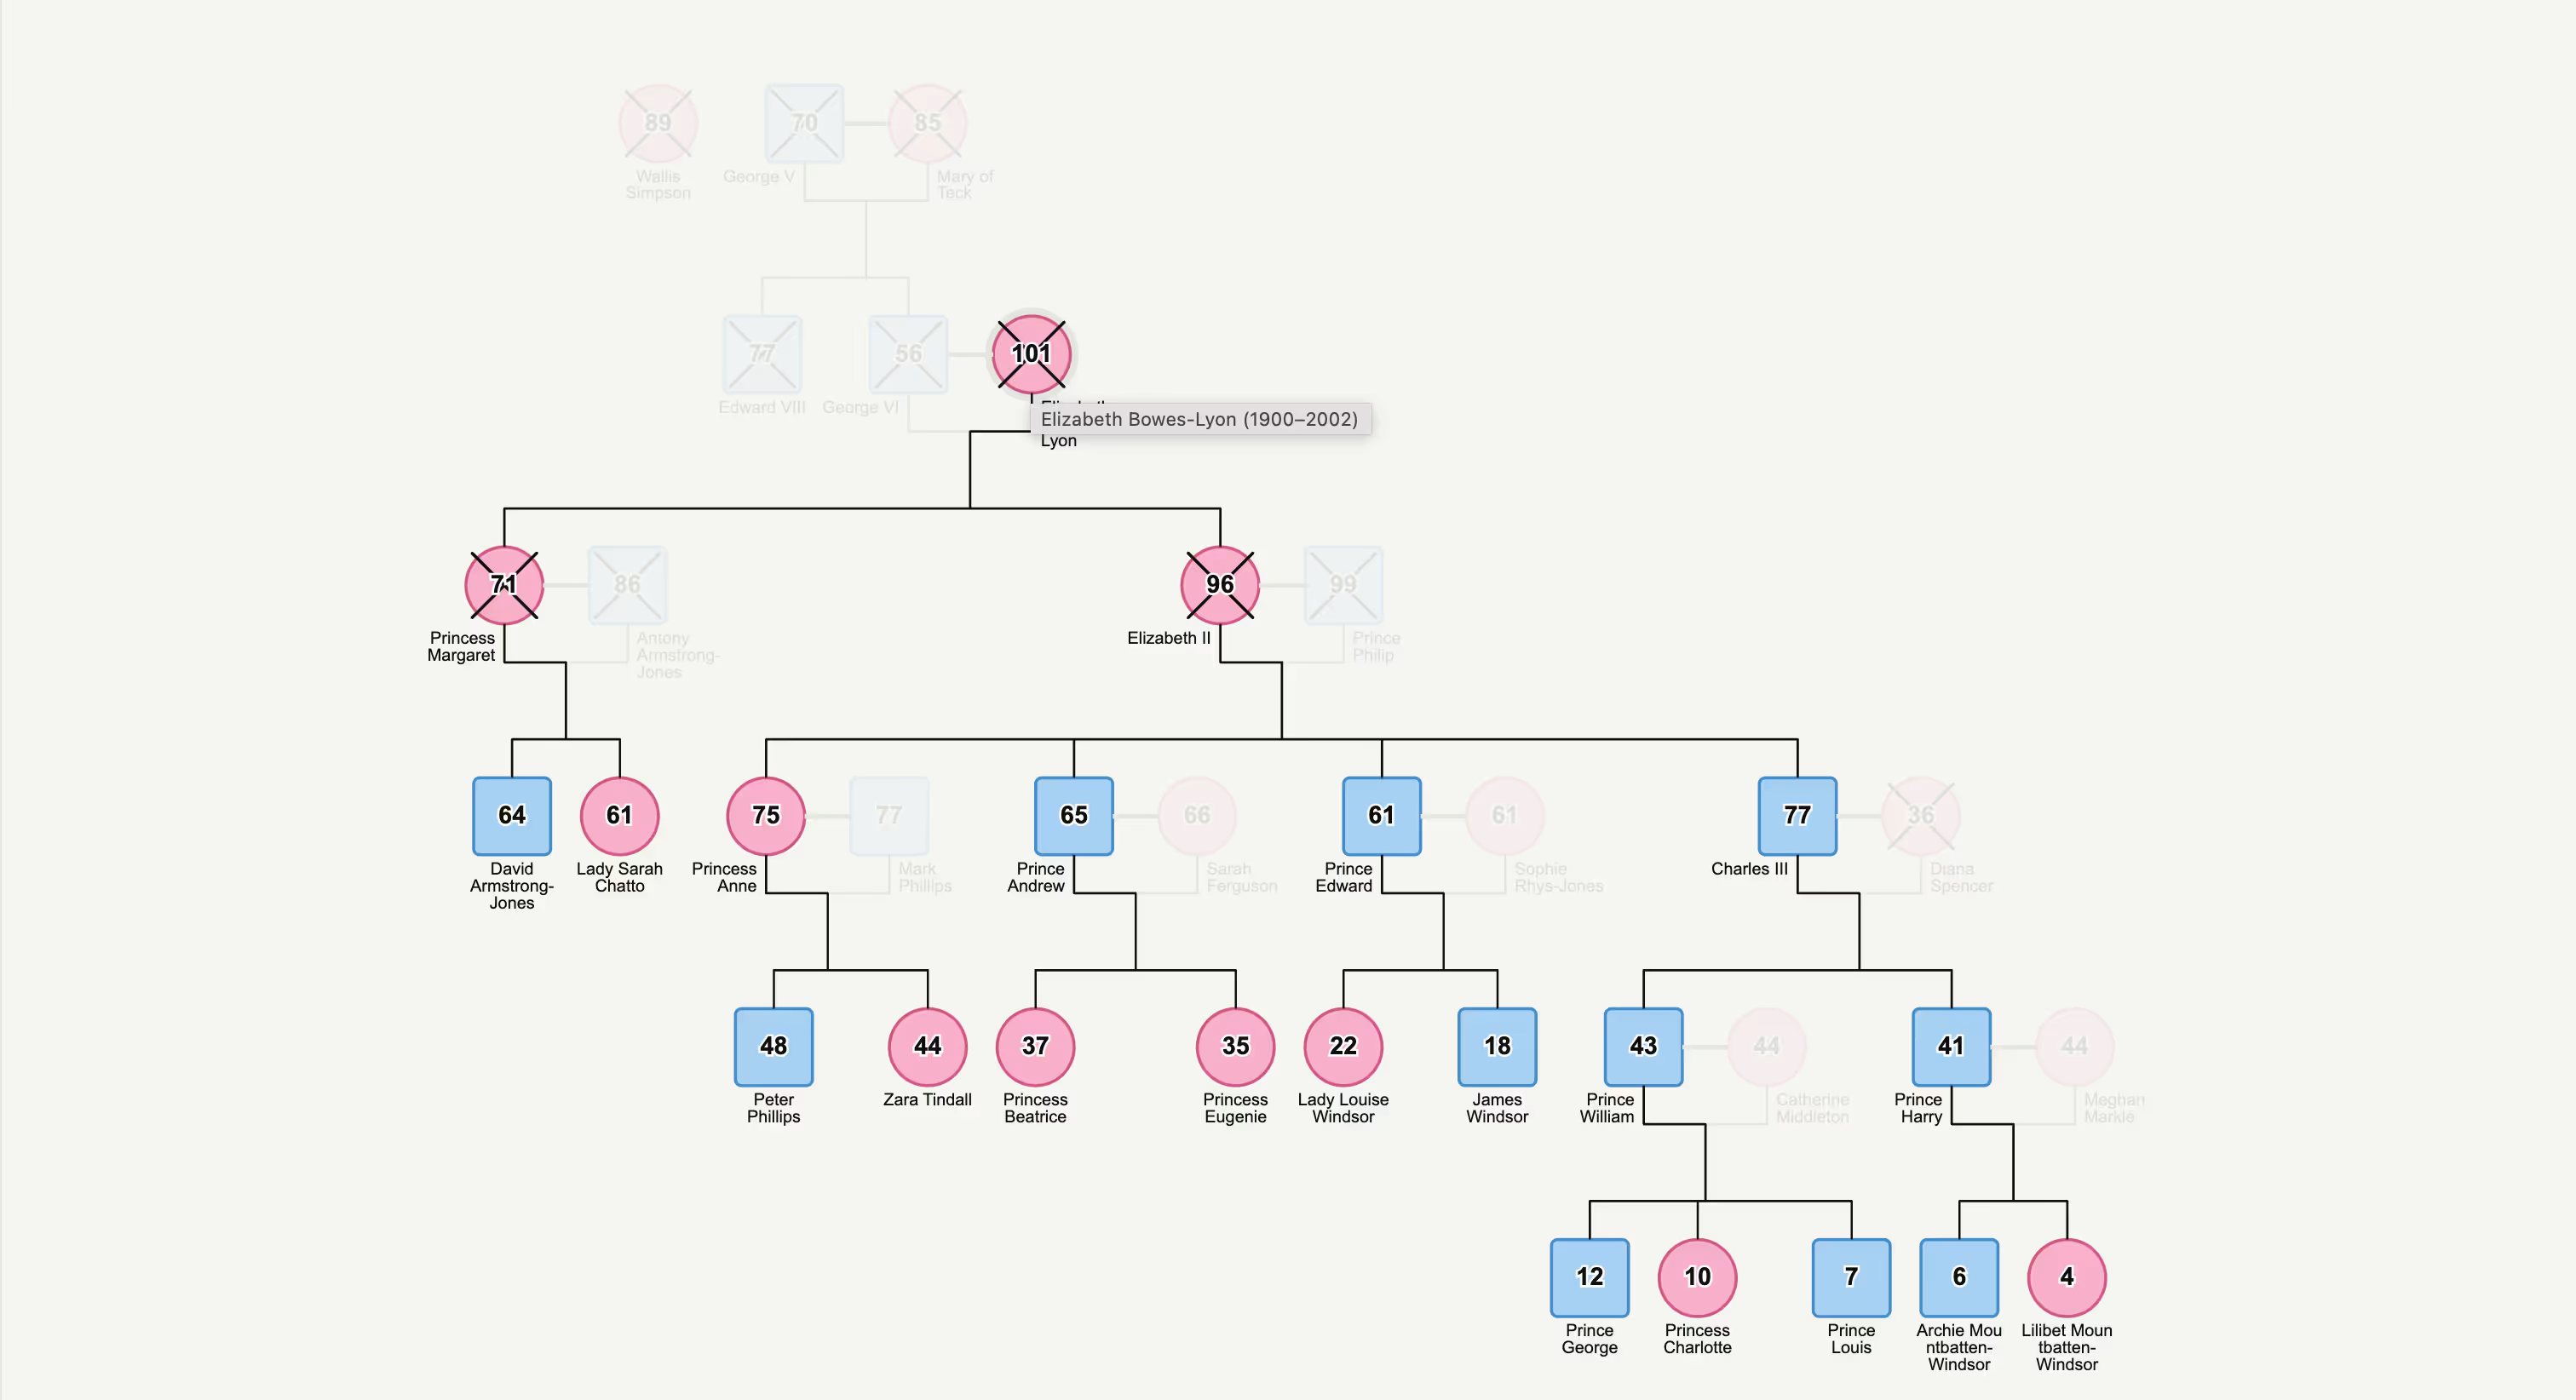
On hover, we highlight the person's direct ancestors and descendants using JointJS built-in highlighters. Related links are brought to the front using z-index offsets, and unrelated cells are dimmed:
-- CODE language-js --
const zByType: Record<string, number> = {
    'genogram.ParentChildLink': defaultZIndex.parentChildLink,
    'genogram.MateLink': defaultZIndex.mateLink,
    'genogram.IdenticalLink': defaultZIndex.identicalLink,
};

paper.on('element:mouseenter', (cellView) => {
    const relatedElIds = new Set([
        treeEl.id,
        ...familyTree.getPredecessors(treeEl).map((el) => el.id),
        ...familyTree.getSuccessors(treeEl).map((el) => el.id),
    ]);

    // Stroke highlight on hovered element
    highlighters.stroke.add(cellView, 'body', HIGHLIGHT_FOCUS, { ... });

    // Bring related links to front (preserving relative order)
    link.set('z', z + defaultZIndex.focusedOffset);

    // Dim non-related cells with CSS class
    highlighters.addClass.add(view, 'root', HIGHLIGHT_DIM, { className: 'dimmed' });
});
The z-index defaults are centralized in theme.ts as defaultZIndex. Each link type has its own default z, and the focusedOffset is added to bring related links to the front while preserving their relative stacking order (e.g. mate links always above parent-child links). On mouseleave, z values are restored from the known defaults rather than reading the current value, avoiding stale-state issues.
The lineage traversal uses a separate familyTree graph (built in utils.ts) that contains only person nodes and parent-child links, enabling efficient ancestor/descendant lookups via getPredecessors/getSuccessors.
Elements are dimmed with opacity, but links use a lightened stroke color instead — because overlapping link segments with opacity would appear darker at intersections, creating visual artifacts:
-- CODE language-js --
.joint-element {
    transition: opacity 0.3s ease;
}
.joint-element.dimmed {
    opacity: 0.1;
}

.joint-link [joint-selector="line"] {
    transition: stroke 0.3s ease;
}
.joint-link.dimmed [joint-selector="line"] {
    stroke: #e2e8dd;
}
The genogram supports two link routing styles, toggled via a button in the UI:
The link style affects multiple parts of the layout:
symbolWidth to accommodate shifted name labelscoupleGap and levelGap for visual claritynameMaxLineCount: 4 vs default 2) since labels are shifted outward and have more roomLayout sizes and colors are centralized in theme.ts. The base sizes object is immutable — link-style-specific overrides are defined separately in linkStyleOverrides:
-- CODE language-js --
export const linkStyleOverrides = {
    fan: {},
    orthogonal: { coupleGap: 30, levelGap: 100, nameMaxLineCount: 4 },
} as const satisfies Record<string, Partial<typeof sizes>>;

const layoutSizes = { ...sizes, ...linkStyleOverrides[linkStyle] };

export const defaultZIndex = {
    person: 1,
    parentChildLink: 2,
    mateLink: 3,
    identicalLink: 3,
    focusedOffset: 10,
};
Shape classes reference these values for their initial z, and the highlighting system uses them to compute focused/restored z values.
Cross-family marriages (where children from different root families marry) create unavoidable edge crossings in a planar layout. To minimize crossings:


.png)